KEYTAKEAWAYS
- Bitcoin's market dominance reached 58.9% with $5 billion Q3 ETF inflows, suggesting institutional confidence despite overall market caution and altcoin underperformance.
- Layer 2 solutions show promising growth, with Base leading at 42.5% market share and daily transactions approaching 10 million across platforms.
- Despite reduced VC investment and exchange volumes, historical patterns suggest Q4 could bring market revival through institutional reallocation and halving effects.

CONTENT
Comprehensive analysis of crypto market trends: Bitcoin’s Q3 performance, Q4 outlook, and key growth sectors. Featuring institutional insights, Layer 2 developments, and market indicators for 2024.
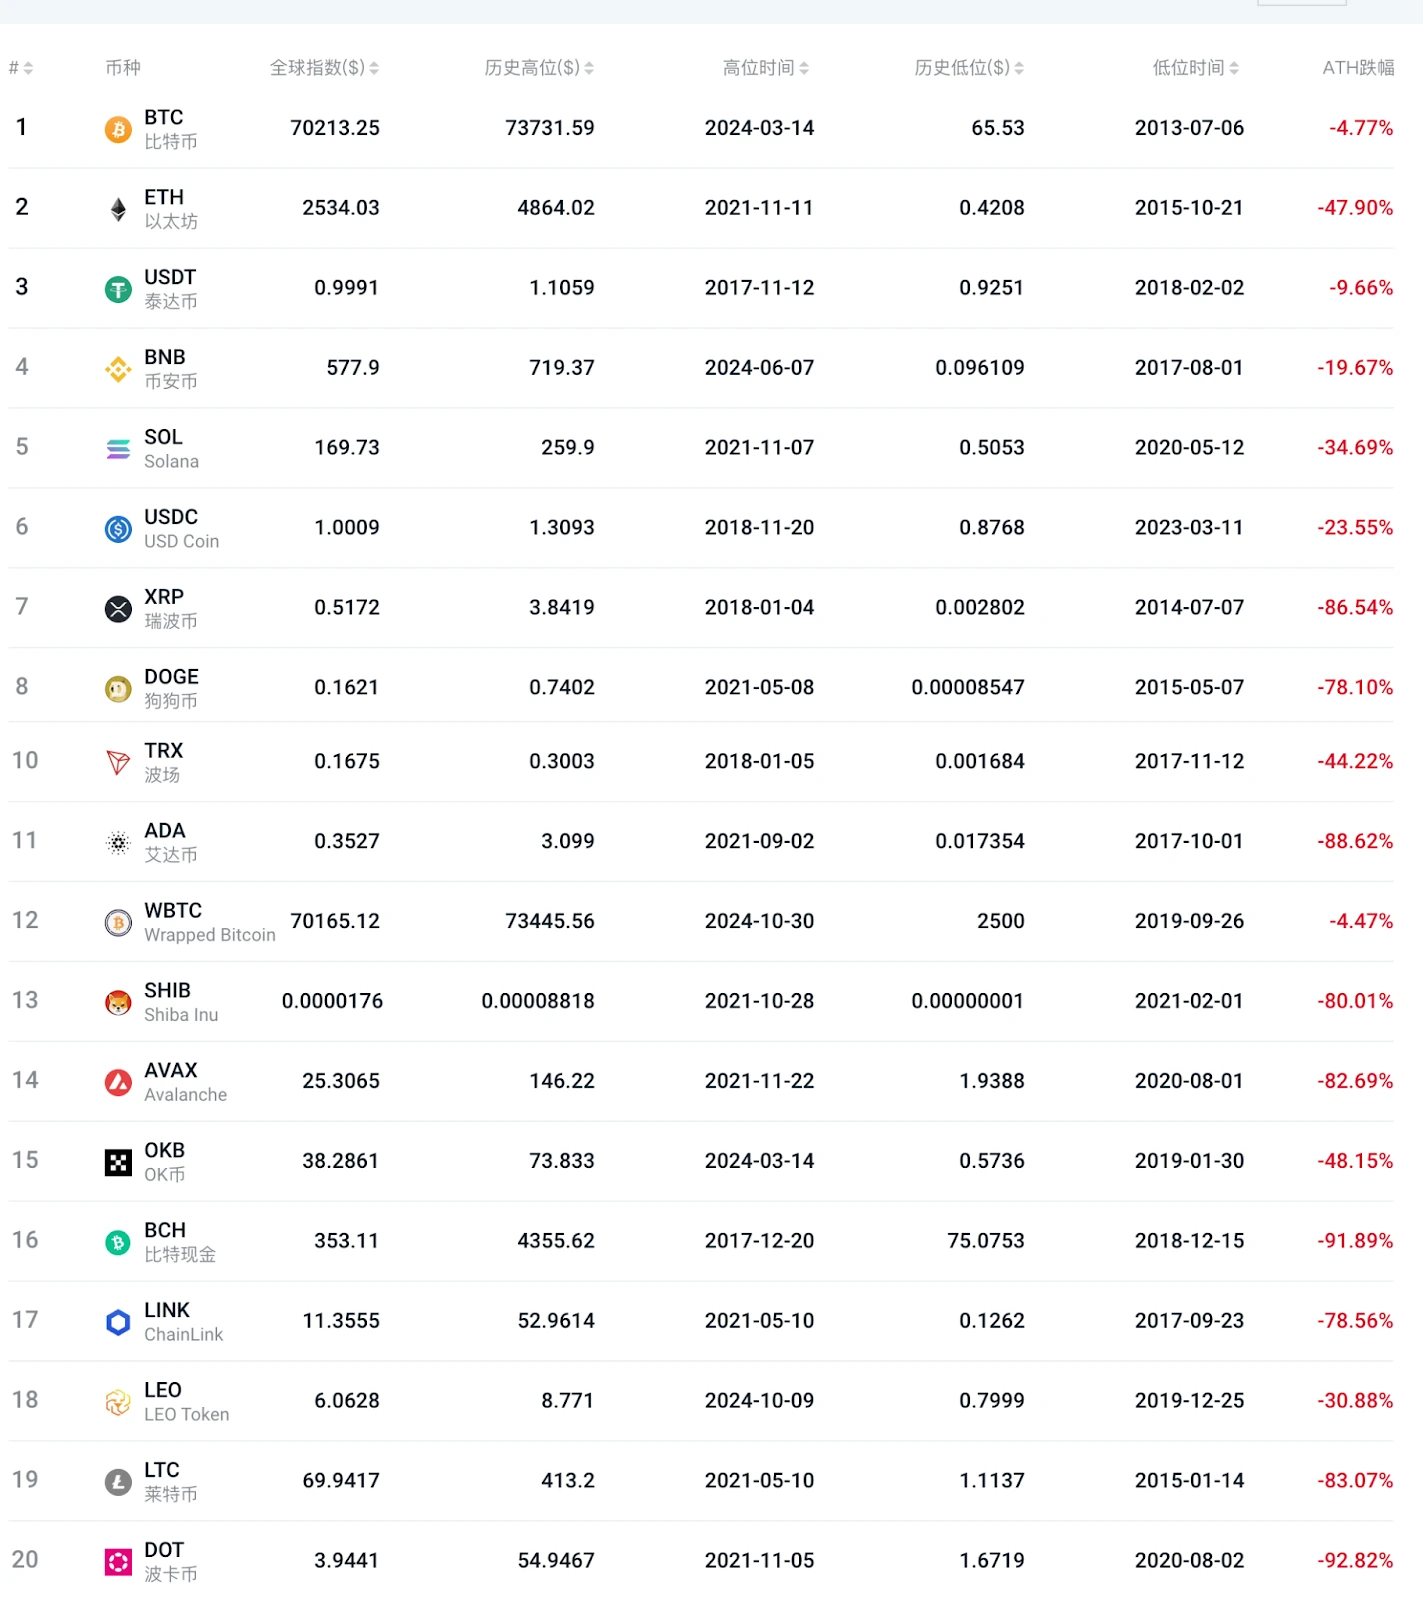
On October 29, Bitcoin surpassed $70,000 after a 4-month interval, reaching a high of $73,600 (according to Bitget data), just a paper-thin distance from its all-time high. However, most altcoins are still either halfway up the mountain or at the bottom. Even ETH is 47% away from its all-time high. The popular public chain SOL is 34% away, while previous bull market favorites like DOGE, SHIB, LINK, ADA, ICP, FIL, and DOT are all 70% to 90% away from their peaks.
Gap from All-Time Highs for Top 20 Cryptocurrencies by Market Cap
(Source: Feixiaohao)
Bitcoin’s global market capitalization dominance has risen from 44% to 58.9%, indicating that the current market remains fearful and frigid, with most investors placing their money in Bitcoin for safety rather than pursuing higher returns from altcoins. As a result, the voices claiming “quick return to bull market” after September’s interest rate cut have diminished, while claims of a “dead bull market” have grown louder.
So, is the fourth halving rally really going to die before it fully develops? Recently, Coinbase, CoinGecko, Coin Metrics, Glassnode, and other crypto platforms and third-party data providers have released their Q3 crypto market/Bitcoin reports. We can collect data from these reports to see whether the current crypto market is truly in a dead bull market or about to soar.
DATA SPEAKS: HOW HAS BITCOIN HISTORICALLY PERFORMED IN Q3?
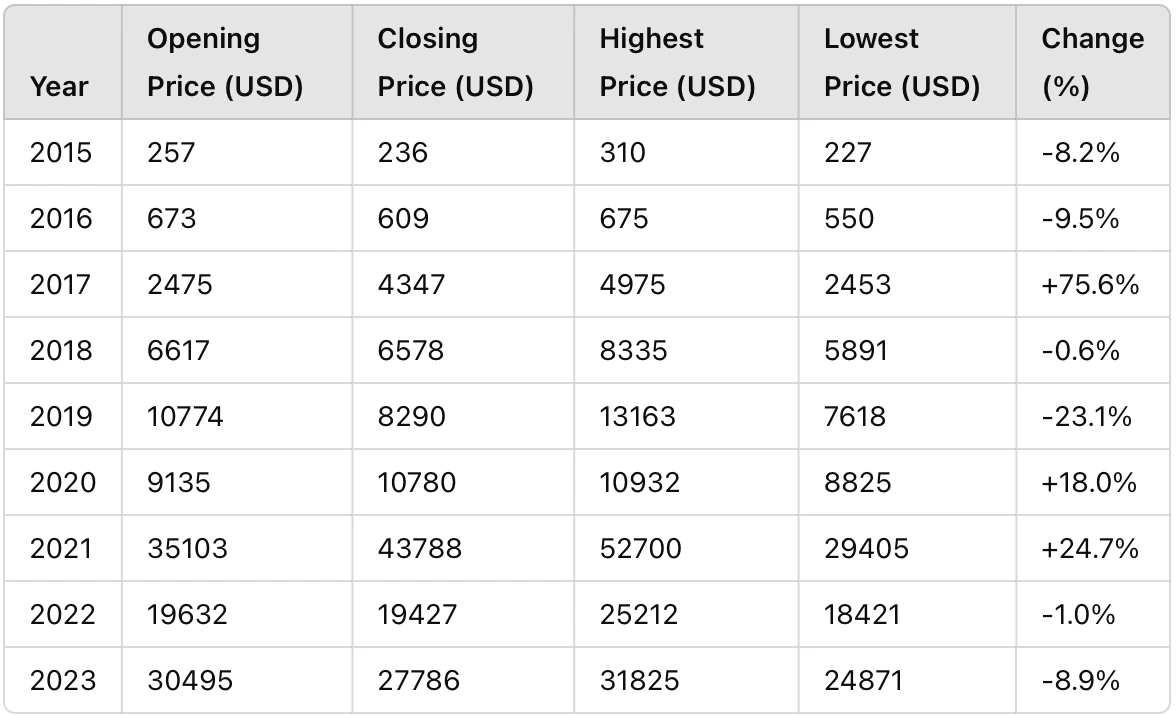
Before diving into the main content, let’s review Bitcoin’s Q3 performance over the past decade. Using TradingView data, we’ve compiled the following information, including opening price, closing price, highest price, lowest price, and percentage changes:
Historical Bitcoin Q3 Performance
(Created by: CoinRank)
From 2015-2023, there were 6 declines and 3 increases, showing overall weak performance. During bull market cycles, Q3 typically performs well, while showing flat or declining performance during bear market cycles.
The main reasons for Q3’s underperformance include:
- Summer market slowdown – Q3 coincides with the Northern Hemisphere’s summer lull, characterized by low market activity as many European and American investors and traders are on vacation
- Lack of catalysts – Q3 typically lacks major market catalysts or technical upgrades, leading to cautious investor sentiment
Additionally, many investors view Q3 as an observation and adjustment period, preferring to wait for Q4 market trends, as Q4 is traditionally when institutions reposition and increase their investments.
IMMINENT CHANGE: IS THE BULL MARKET ABOUT TO ENTER THE FAST LANE?
Looking at two key numbers: Bitcoin’s fourth halving occurred 6 months ago, and Bitcoin’s market dominance has reached 58.9%. Historically, both these indicators signal the start of a bull market’s acceleration phase.
According to CoinGecko’s report data, Q3 Bitcoin spot ETF net inflows reached $5 billion, indicating strong institutional buying interest. Meanwhile, stablecoin market capitalization (USDT, USDC, etc.) reached a record $170 billion, with year-to-date trading volume approaching $20 trillion.
Although Q3’s overall trading volume and price increases were modest, the market has quietly built a solid foundation, and September’s Federal Reserve interest rate cut has brought favorable winds.
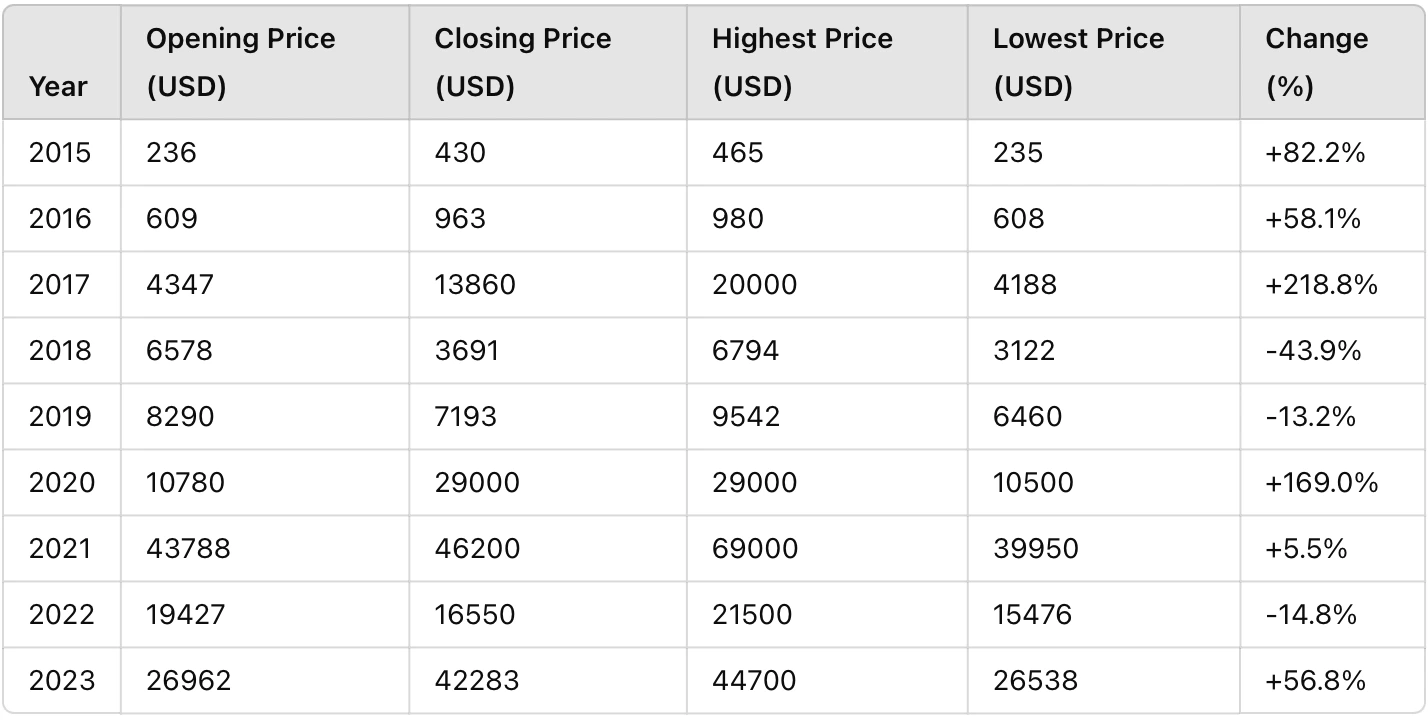
Historically, Q4 has been the best-performing quarter for the crypto market, as shown below:
Historical Bitcoin Q4 Performance
(Created by: coinrank)
From 2015-2023, Bitcoin showed 6 increases and 3 decreases, exactly opposite to Q3’s performance pattern. Both halving years (2016 and 2020) ended with substantial gains.
The main factors driving Q4 increases include:
- Year-end window dressing effect and asset reallocation – The end of the year typically marks a period of “window dressing” in global financial markets, where institutional investors readjust their portfolios to showcase better year-end performance. This asset reallocation process often generates increased demand for Bitcoin.
- Holiday season consumption peak – Q4’s major holidays like Christmas and New Year’s indirectly boost market activity and strengthen investor buying demand.
- Bitcoin halving timing – Bitcoin halving events typically occur in Q2 (May 2020, April 2024). Consequently, the supply reduction effects gradually materialize during the halving year’s end and the following year, driving prices upward.
- Tax considerations – In Western countries, investors often make year-end investments for tax planning purposes, seeking potential tax benefits or capital gains tax reductions in the new year, which partially drives Bitcoin demand.
- Market cyclicality – The crypto market’s cyclical nature tends to create heightened market sentiment at year-end, especially after the performance of the first three quarters, leading to investor expectations for Q4 gains. These combined factors typically result in Bitcoin’s strong Q4 performance, earning it the title of the “golden quarter.”
INSTITUTIONAL REPORT INSIGHTS: WHAT ARE THE UPCOMING WEALTH CODES?
From reports by CoinGecko, Glassnode, Coinbase, and other institutional platforms, several wealth opportunities for the upcoming halving bull market can be identified.
Key sectors include L1 Blockchains, Layer 2, and Memecoins.
ETH remains the undisputed king of L1 blockchains with around 40% market share, though Q3 trading volume declined 19.6% to $130.5 billion. Driven by numerous memecoins, Solana’s DEX trading activity continues to flourish, reaching 22% market share. As infrastructure, quality public chain projects like TON, TIA, SUI, and APT are worth watching in the fourth halving bull market.
In Q3, Layer 2 projects showed impressive performance, with ETH Layer 2 daily transactions approaching 10 million. Since the beginning of the year, Base has seen significant network activity growth, becoming the most active L2 with 42.5% of all Q3 transactions, followed by Arbitrum at 18.9% and Blast at 8.1%.
Memecoins performed exceptionally well in Q3 2023, driven by the U.S. election and AI technology integration, as previously discussed in “Ultimate Guide: How to Find and Invest in High-Potential Memecoins (2024).”
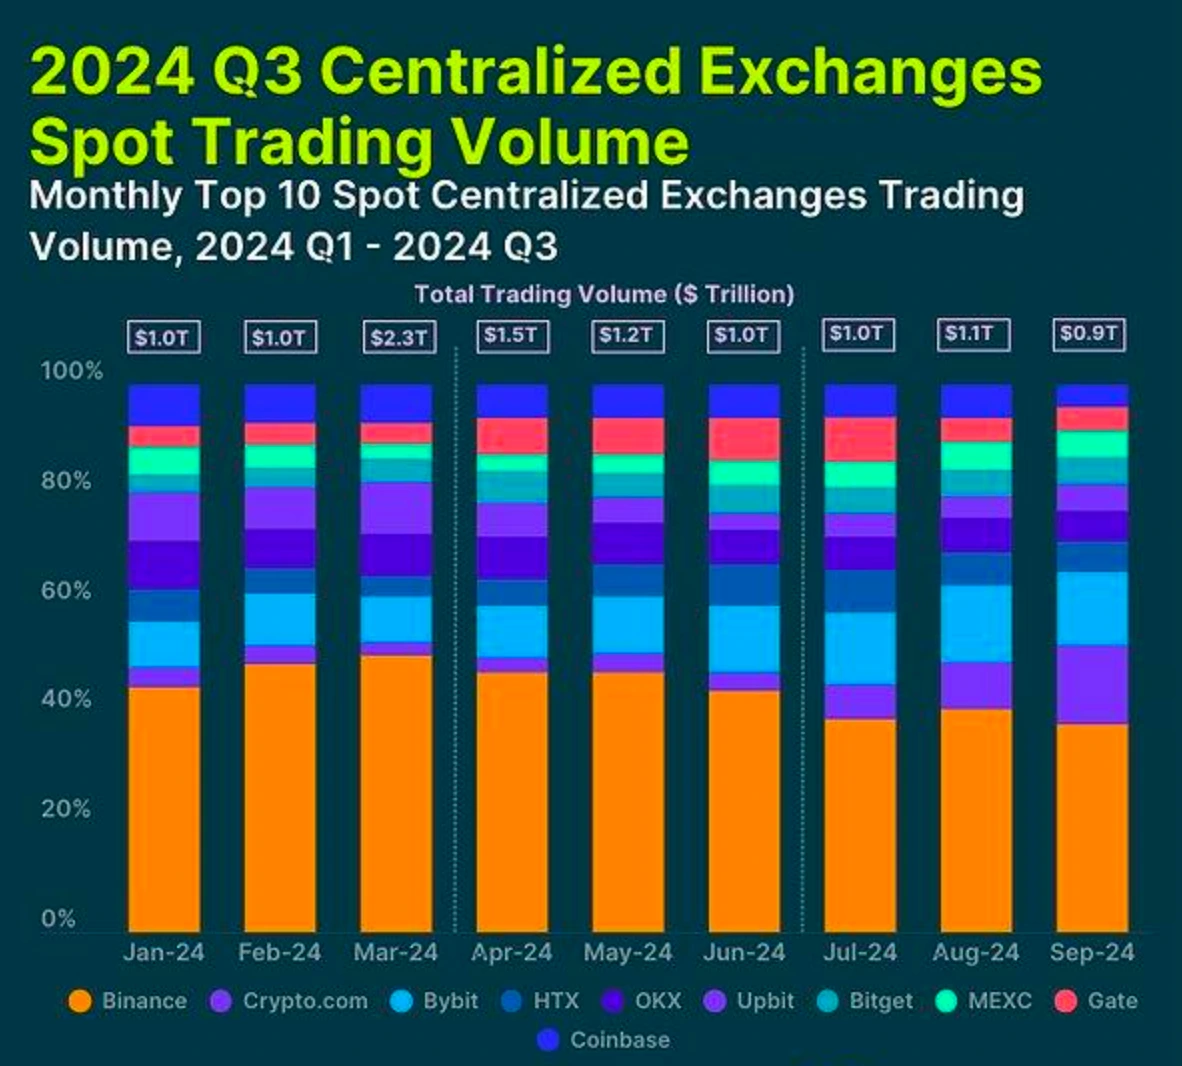
Current concerns include Coinbase’s underwhelming Q3 earnings and the top ten centralized exchanges’ sluggish performance. Q3 spot trading volume for the top ten exchanges declined by 14.8% to $3.05 trillion.
Q3 Spot Trading Volume for Top 10 Centralized Exchanges
(Source: CoinGecko)
The low spot trading volume indicates no market-wide popular coins emerged in Q3, and the market remained sluggish despite the interest rate cut.
Another concern comes from GalaxyDigital’s report: Q3 2024 venture capital investment in crypto startups totaled $2.4 billion across 478 deals, down 20% and 17% respectively from the previous quarter, far below 2021 and 2022 levels. This might indicate declining institutional interest in crypto markets, explaining the lack of recent breakthrough new coins.
The sluggish Q3 has ended, and the golden Q4 has begun. November promises to be extraordinary, with the U.S. presidential election and Federal Reserve meetings approaching. The market could swing dramatically either way, but regardless, the darkest night has passed. Maintain patience and wait for the sunshine to spread across all directions.


