


KEYTAKEAWAYS
- Moving Averages smooth price data to help traders identify trends and market strength, reducing noise for better analysis.
- Different MA types serve various trading styles, with SMA for stability, EMA for quick signals, and WMA for linear weighting.
- Golden & Death Crosses signal trend shifts, guiding traders in identifying bullish or bearish momentum for strategic entries and exits.
CONTENT
Moving Average (MA) is a key technical analysis tool that smooths price fluctuations to help traders identify trends. Learn how to calculate, apply, and optimize MA strategies for better trading decisions.
WHAT IS MOVING AVERAGE (MA)?
Moving Average (MA) is a technical analysis indicator that calculates the average price over a specific period to smooth out price fluctuations and help traders identify market trends and strength.
Since Moving Average represents the average transaction price over a given period, it can be considered a consensus price among market participants.
Additionally, by averaging price data, it reduces market noise, making trend identification clearer and aiding investors in making informed decisions.
➤ How to Calculate Moving Average
To calculate the Moving Average for a given day xx over yy days, the formula is:
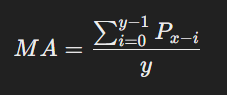
where PP represents the closing price, and yy is the selected moving average period.
For example, to calculate today’s 5-day Moving Average, sum the closing prices of the past five days and divide by 5. The same approach applies to different timeframes, such as 4-hour, half-day, daily, weekly, or monthly moving averages.
➤ Applications of Moving Average
- Short-term traders: Typically use short-period Moving Averages like 5-minute, 10-minute, or 20-minute MAs to capture quick market movements.
- Long-term investors: Prefer longer-period Moving Averages, such as daily, bi-weekly, monthly, or even yearly MAs, to analyze long-term trends.
Moving Average is widely used in technical analysis, serving as a tool for trend identification, support and resistance levels, and trading signals, making it an essential indicator for traders and investors alike.
>>> More to read: What are Bollinger Bands & How to Use Them
TYPES OF MOVING AVERAGE (MA)
There are three main types of Moving Averages:
- Simple Moving Average (SMA)
- Exponential Moving Average (EMA)
- Weighted Moving Average (WMA)
➤ Simple Moving Average (SMA)
The Simple Moving Average (SMA) is the most commonly used type of Moving Average.
It calculates the average price over a specific period by summing up the closing prices of each candlestick and dividing by the total number of periods.
Since each candlestick carries the same weight, SMA provides a smooth trend line, reducing market noise and reflecting the overall consensus of buyers and sellers.
➤ Exponential Moving Average (EMA)
Some traders believe that more recent price movements have a greater impact on the market, leading to the creation of the Exponential Moving Average (EMA).
Unlike SMA, EMA assigns greater weight to recent prices, making it more sensitive to price fluctuations and trend reversals.
Because of this, EMA is a popular choice among short-term traders who need faster signals for decision-making.
➤ Weighted Moving Average (WMA)
Similar to EMA, the Weighted Moving Average (WMA) also gives more importance to recent price data.
However, the difference is that WMA applies a linear weighting system, meaning the most recent data points have a proportionally higher influence on the calculation.
Compared to SMA and EMA, WMA is less commonly used in the market but remains an option for traders who want a more responsive moving average.
>>> More to read: Crypto Beginner’s Guide | What, Why, Where, When, Who
HOW TO USE MOVING AVERAGE?
All technical analysis methods are based on past market behavior and product trends to estimate potential future directions and price movements.
However, these are not absolute values or guarantees but rather tools to identify patterns from historical data and apply them to current market conditions.
Here are two common ways to use Moving Averages effectively:
1. Tracking Price Trends
Investors often use Moving Averages (especially Exponential Moving Averages (EMA)) to analyze current price trends and make future price predictions.
The length of the EMA is not fixed, but commonly used periods include 20-day and 60-day EMAs. Some traders also use Fibonacci numbers to determine optimal EMA settings.
By observing whether the price remains above or below the moving average, traders can assess the trend direction:
- If the EMA is steadily rising, it suggests a bullish trend, meaning the price has upward momentum. Investors may look for buying opportunities.
- If the EMA is steadily declining, it signals a bearish trend, meaning the price is losing momentum. Investors may look for short-selling opportunities.
2. Moving Average Crossovers
Once traders have identified the overall market trend, they need to pinpoint the best entry points.
One of the simplest yet powerful methods is using moving average crossovers to determine shifts in trend direction.
- When a shorter-period moving average (e.g., 20-day EMA) crosses above a longer-period moving average (e.g., 60-day EMA), it indicates an uptrend, known as a Golden Cross, which is a bullish signal.
- When a longer-period moving average crosses above a shorter-period moving average, it indicates a downtrend, known as a Death Cross, which is a bearish signal.
✎ Key Signals:
✔ Golden Cross (Bullish Crossover): Shorter MA crosses above longer MA → Uptrend signal, suitable for long positions.
✘ Death Cross (Bearish Crossover): Longer MA crosses above shorter MA → Downtrend signal, suitable for short positions.
By applying these Moving Average strategies, traders can better navigate market trends, improve entry and exit timing, and enhance their overall trading strategy.
>>> More to read: 4 Trusted Crypto Market Live Trackers for Staying on Trend
GRANVILLE’S 8 RULES FOR MOVING AVERAGES
Granville’s 8 Rules use the relationship between price and Moving Averages to generate buy and sell signals.
This strategy, developed by the renowned American volume and price analysis expert Joseph Granville, is a well-known technical analysis method.
Granville believed that Moving Averages represent the direction of the trend.
When price fluctuations deviate significantly from the trend (i.e., when prices move far away from the moving average), they will eventually correct in the trend’s direction, creating clear buying or selling opportunities.
By analyzing how prices interact with the Moving Average, including breakouts, rejections, and deviations, Granville identified eight key scenarios that can serve as entry and exit signals.
➤ Buy Signals
- Breakout: When the Moving Average shifts from a downtrend to a flat or upward trend, and the price breaks above it from below, it signals a buying opportunity.
- False Breakdown: If the price temporarily falls below the Moving Average but quickly recovers above it while the MA remains in an uptrend, this confirms a strong buying signal.
- Support: When the price stays above the Moving Average and corrects downward without breaking the MA, then rebounds higher, it indicates a continuation of the uptrend and a buying opportunity.
- Bottom Fishing: If the price rapidly declines below the Moving Average and significantly deviates downward, but then starts rebounding toward the MA, it suggests an oversold condition and a buy signal.
➤ Sell Signals
- Reversal: If the price surges far above the Moving Average and then reverses downward, correcting back toward the MA, it signals a selling opportunity.
- Breakdown: When the Moving Average shifts from an uptrend to a flat or downtrend, and the price drops below it from above, it indicates a bearish signal.
- False Breakout: If the price breaks above the Moving Average but quickly falls back below it while the MA remains in a downtrend, this confirms a strong selling signal.
- Resistance: When the price stays below the Moving Average and repeatedly fails to break above it, the MA acts as resistance, signaling a bearish continuation and a short-selling opportunity.
➤ 4 Core Principles of Granville’s Eight Rules
- Do not short when the Moving Average is rising, and do not go long when it is declining.
- Moving Averages act as support, resistance, and trend indicators, helping determine bullish and bearish setups.
- Bullish and bearish price structures are trend characteristics. Once a structure reverses, traders should consider switching positions.
- Golden Crosses and Death Crosses occur at the intersection of past price movements and often signal strong trend changes, creating trading opportunities.
By understanding and applying Granville’s 8 Rules, traders can better anticipate market trends, optimize their entries and exits, and enhance their trading strategies using Moving Averages.
>>> More to read: Crypto Trading Strategies for Beginners