


KEYTAKEAWAYS
- Multiple indicators suggest crypto market nearing cyclical bottom, with Bitcoin testing $92K-89K support levels while maintaining long-term bullish structure despite current bearish momentum.
- Federal Reserve's high interest rates (4.25-4.50%) and continued balance sheet reduction of $2T significantly restrict market liquidity, limiting sustained upward movement.
- Market recovery depends on Fed cutting rates below 3% and ending balance sheet reduction, while excessive altcoin supply (11M+ tokens) hampers broad market recovery.
CONTENT
Analysis of crypto market’s potential bottom through on-chain metrics, technical indicators, and Fed policy impact. Explores BTC’s $92K support, market liquidity issues, and conditions needed for altcoin season revival.
Following the “February 3rd” crash, Bitcoin has shown consecutive doji candlesticks on the daily chart, with market sentiment dropping to new lows for the year. Trading volume has also shrunk, and it seems that overnight, the market has plunged into a crypto winter.
Looking at a longer timeframe, since Bitcoin broke above $100,000 last December, it has been fluctuating around this level. After the Federal Reserve paused rate cuts last month, bearish sentiment gradually intensified. While Bitcoin hasn’t declined significantly, many altcoins have continuously hit new lows, with ETH being no exception, ultimately leading to the “February 3rd” crash.
The January CPI data released on the 12th showed an unexpected rise in the annual rate, with core CPI monthly rate rebounding above expectations, triggering market panic. The CPI surprise even led to speculation about potential Fed rate hikes. Additionally, Trump’s threats of tariffs further contributed to pessimistic market expectations.
So where does the crypto sphere stand now? Can Bitcoin lead a market rebound and potentially reach new highs? Is this a good opportunity to “buy when nobody’s asking”?
ON-CHAIN/MARKET DATA INDICATORS: IS NOW A GOOD TIME TO BUY?
Since Bitcoin’s creation in 2009, numerous data indicators have emerged, such as the Bitcoin Ahr999 indicator, Bitcoin Rainbow Chart, MVRV, and Puell Multiple. These indicators can help assess Bitcoin’s current stage and, by extension, the overall crypto market phase.
Ahr999 Indicator
Current value: 1.17, below the accumulation reference value of 1.2, indicating Bitcoin prices have entered a suitable DCA (Dollar-Cost Averaging) zone. Values below 0.45 are typically considered bottom signals, while values below 1.2 suggest good DCA opportunities. Based solely on the Ahr999 indicator, Bitcoin appears suitable for gradual position building.
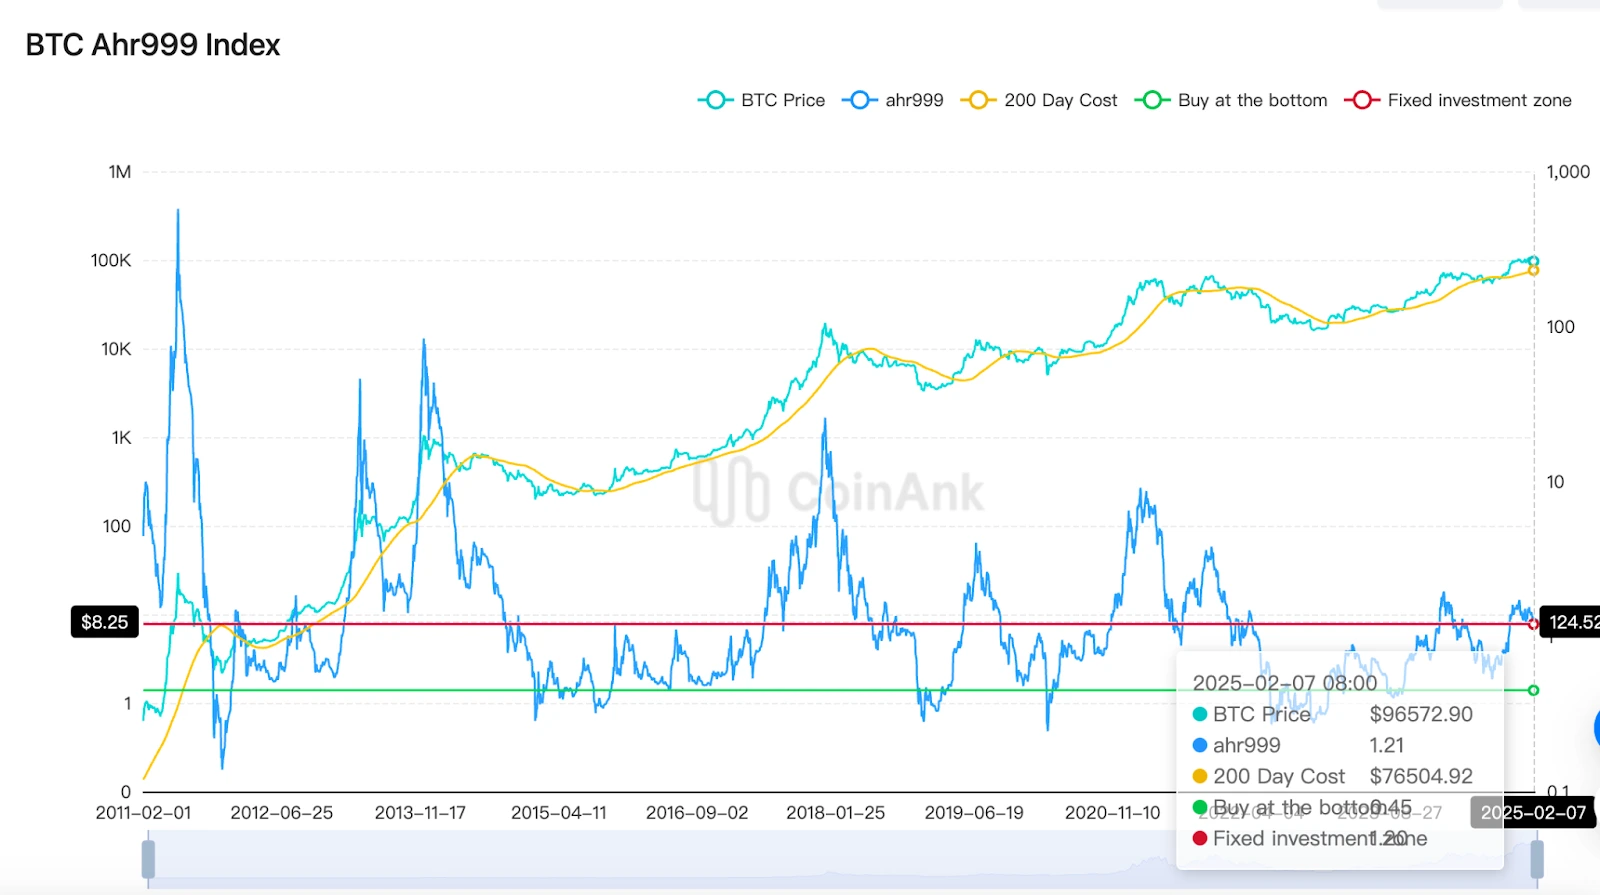
(Source: CoinAnk)
Bitcoin Rainbow Chart Bitcoin price currently remains in the “HODL” zone of the rainbow chart, not approaching either the bottom (blue area) or top (red area). The rainbow chart has accurately predicted Bitcoin’s cycle tops and bottoms multiple times in the past. Currently, it shows no clear bottom signals but indicates Bitcoin price remains within the logarithmic growth channel, suggesting a bullish long-term trend despite potential short-term volatility.
Bitcoin Rainbow Chart
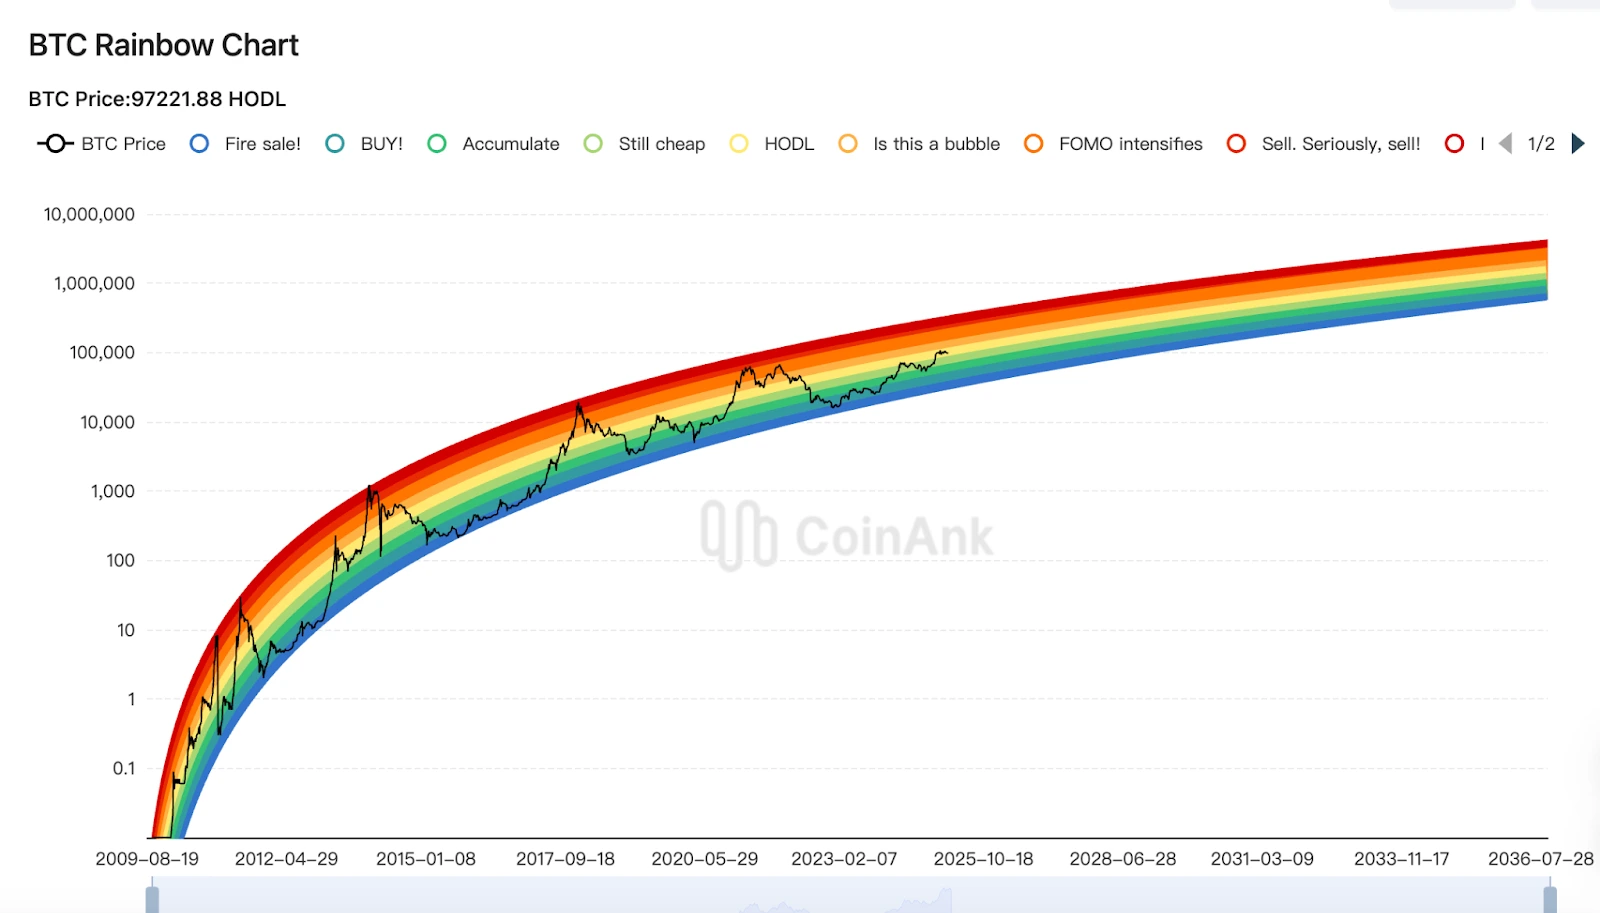
(Source: CoinAnk)
MVRV Indicator: Market Value to Realized Value Ratio The MVRV ratio is between 2.5 and 3, well below its historical peak of 7, indicating market valuation isn’t excessive but hasn’t reached obvious bottom territory (typically considered when MVRV is below 1). The current value suggests the market is in a medium valuation range.
MVRV Indicator
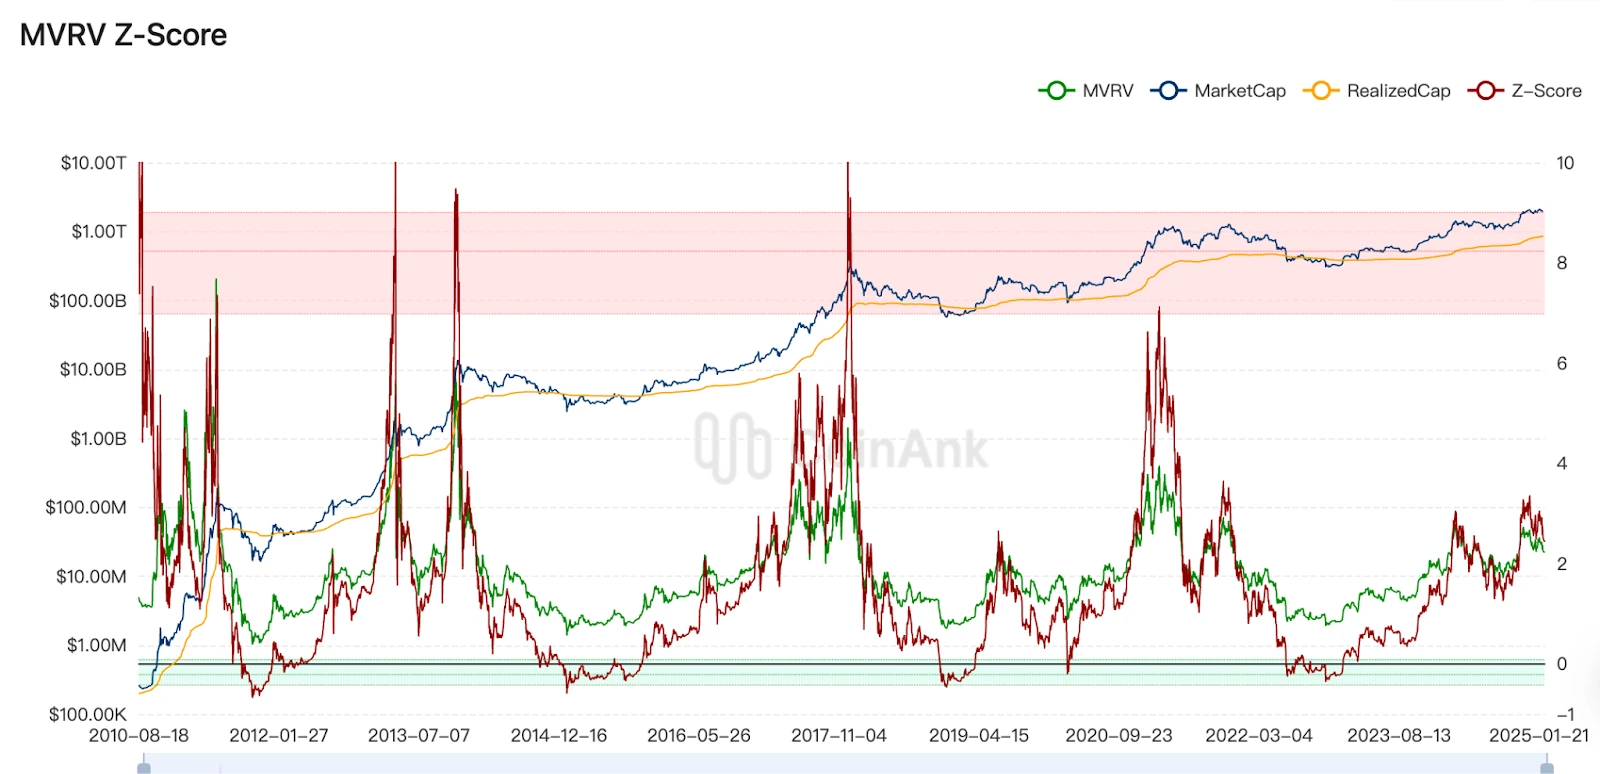
(Source: CoinAnk)
Puell Multiple Currently at 0.97, far from the top range and comparable to May 2017 levels, indicating the market isn’t overheated. The Puell Multiple typically measures miners’ revenue relative to historical averages, with low values suggesting reduced miner income, potentially signaling market bottoms.
Puell Multiple
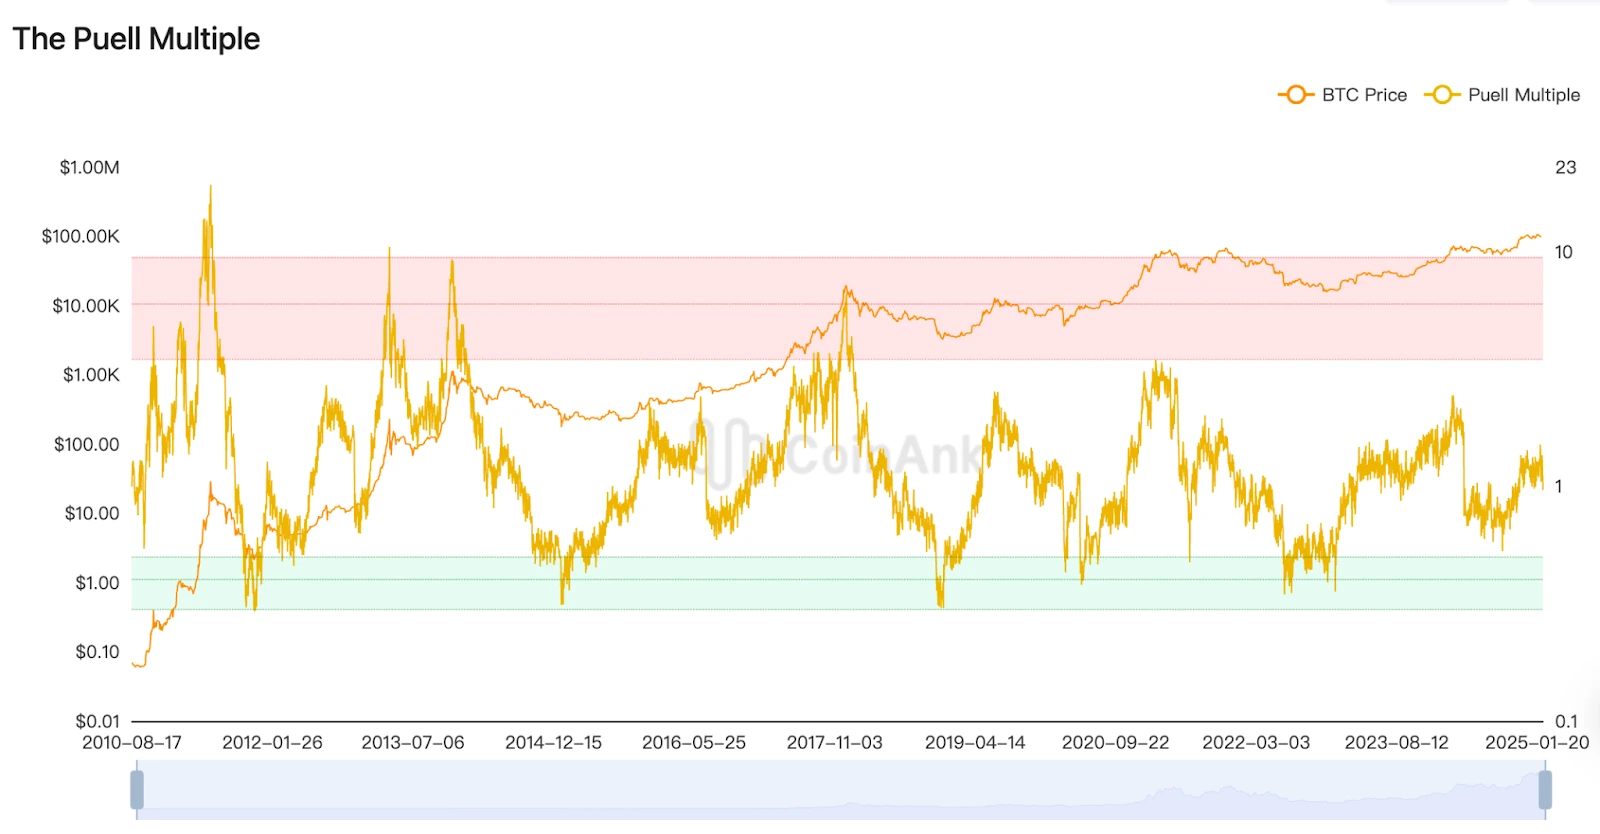
(Source: coinAnk)
Comprehensive analysis suggests that current Ahr999, MVRV ratio, and rainbow chart indicators show Bitcoin price hasn’t entered clear bottom territory, but extreme bearish sentiment might indicate an approaching cyclical bottom.
From a long-term perspective, the MVRV Z-Score and rainbow chart indicate Bitcoin still has significant upside potential, with the current adjustment possibly representing a normal correction within a bull market.
Combining these indicators suggests Bitcoin price may be approaching a cyclical bottom, making it suitable for gradual position building through DCA.
TECHNICAL DATA INDICATOR ANALYSIS: MARKET MAY NEED TIME TO STABILIZE THROUGH CONSOLIDATION
*This section primarily analyzes BTC’s technical indicators as of February 12, 2025. Other cryptocurrencies’ trends generally follow BTC.
From a Bollinger Bands perspective, Bitcoin’s daily price fluctuates near the lower band, typically indicating oversold conditions and a possible approaching cyclical bottom. However, on the weekly timeframe, BTC oscillates near the middle band, showing a tug-of-war between bulls and bears without clear breakout signals, suggesting continued consolidation. The monthly Bollinger Bands show price remains near the upper band, indicating significant resistance. Overall, Bollinger Band technical indicators suggest BTC needs a short-term rebound but requires further confirmation for medium to long-term bottom formation.
BTC Bollinger Bands
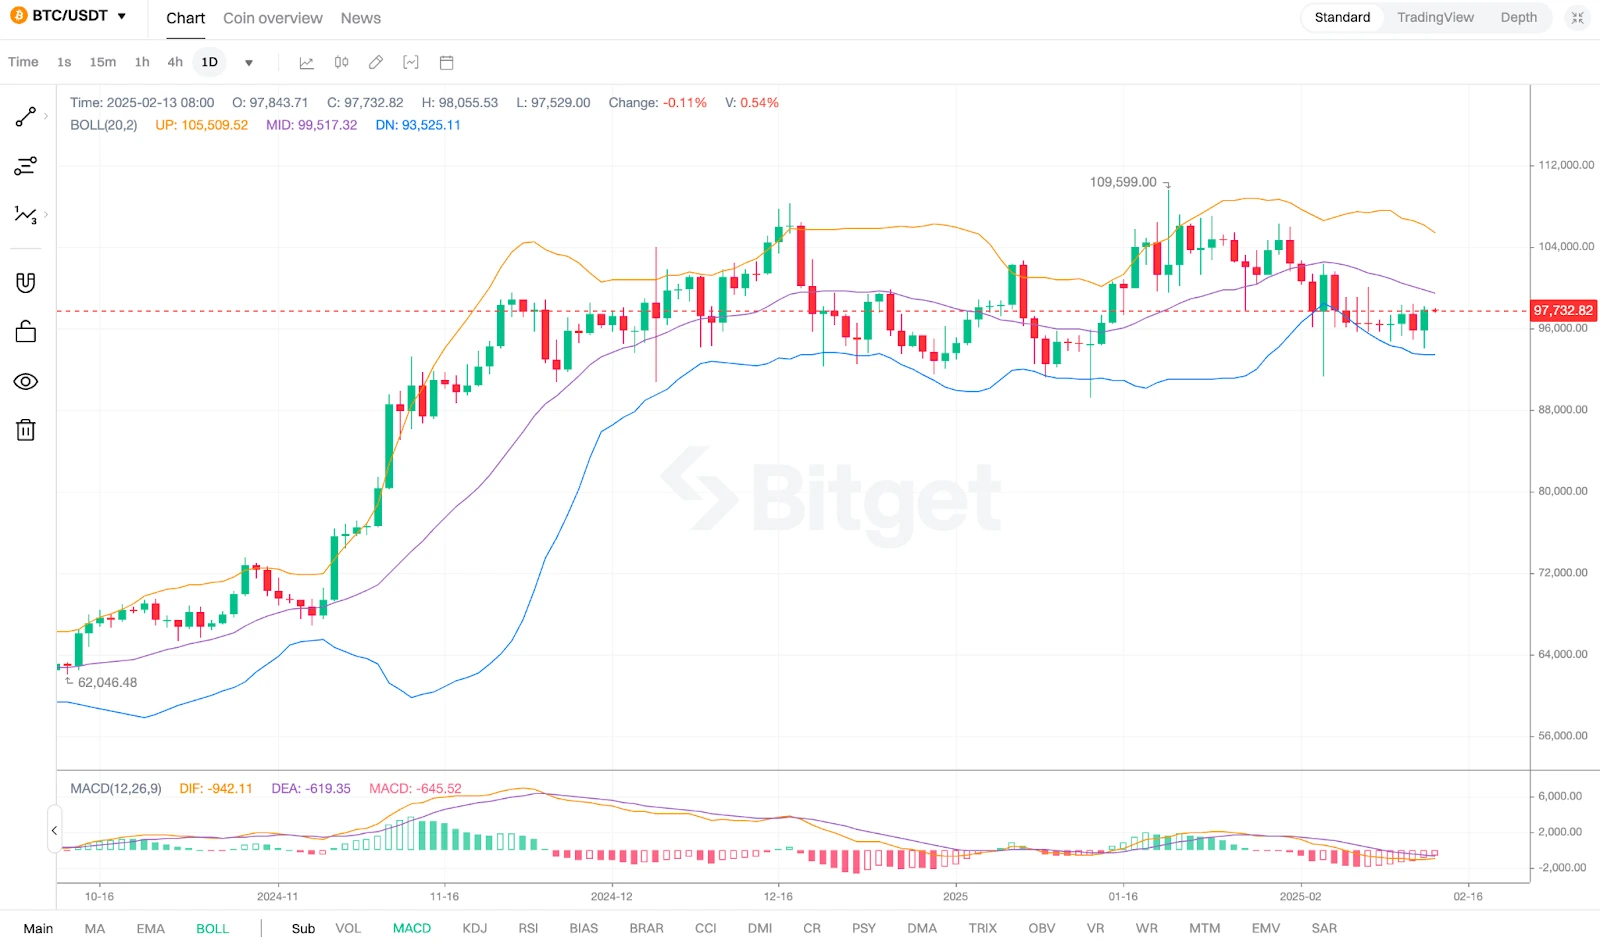
(Source: Bitget)
Moving Average (MA) Analysis: For daily candlesticks, the relationship between short-term MA (such as MA10) and long-term MA (such as MA30) shows MA10 slightly above MA30, indicating some support from short-term trends, though price fluctuation around MA10 shows certain pressure. From the weekly candlesticks perspective, the 52-week Simple Moving Average (SMA) indicates Bitcoin still has upward potential, despite recent price corrections, maintaining a bullish long-term trend. Looking at monthly candlesticks, monthly MA shows price remains in an upward channel without breaking key support levels, indicating no fundamental change in the long-term trend.
MACD Analysis: For daily candlesticks, the MACD histogram remains negative and gradually lengthening, indicating strong bearish momentum. The market may still be in an adjustment phase, but MACD shows no clear trend, suggesting the market may be seeking direction. From a weekly perspective, the weekly MACD has shown a death cross, indicating potential continued volatility for 1-2 months. Monthly MACD shows momentum remains weak but without obvious downward trend, suggesting the market may be in a consolidation phase.
BTC Daily MACD
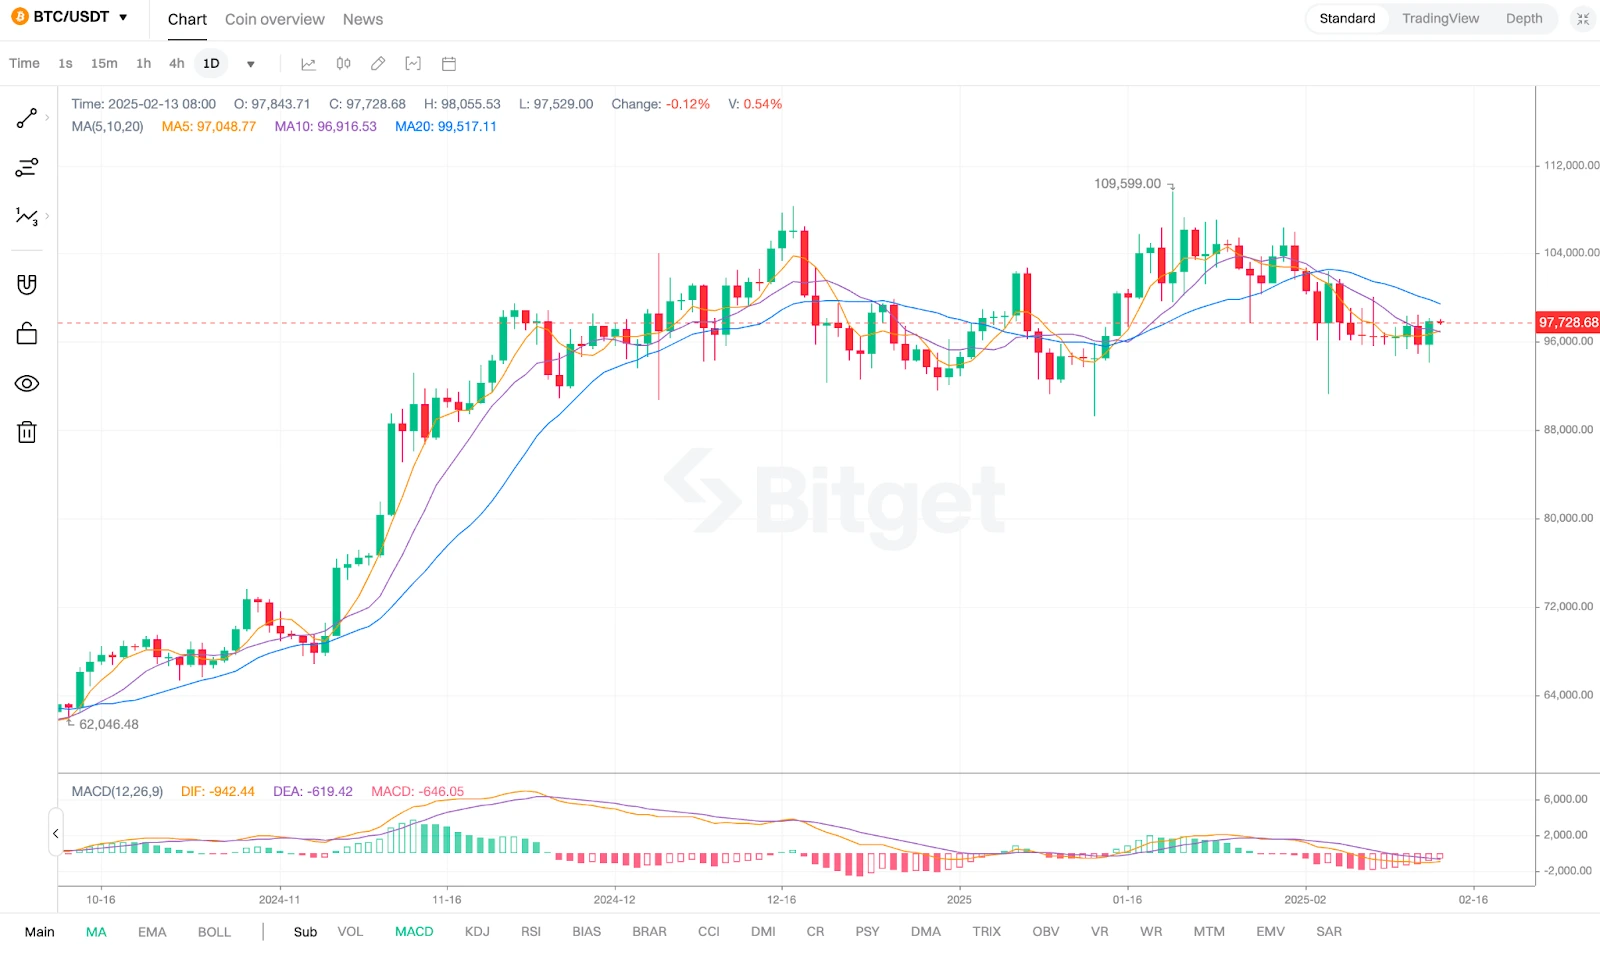
(Source: Bitget)
RSI Analysis: For daily candlesticks, RSI values are near the neutral zone, indicating neither severe overbought nor oversold conditions. If RSI drops further into the oversold zone (typically below 30), it might signal the formation of a cyclical bottom. Weekly RSI shows neutral market sentiment, not yet entering oversold territory, suggesting continued consolidation.
BTC RSI
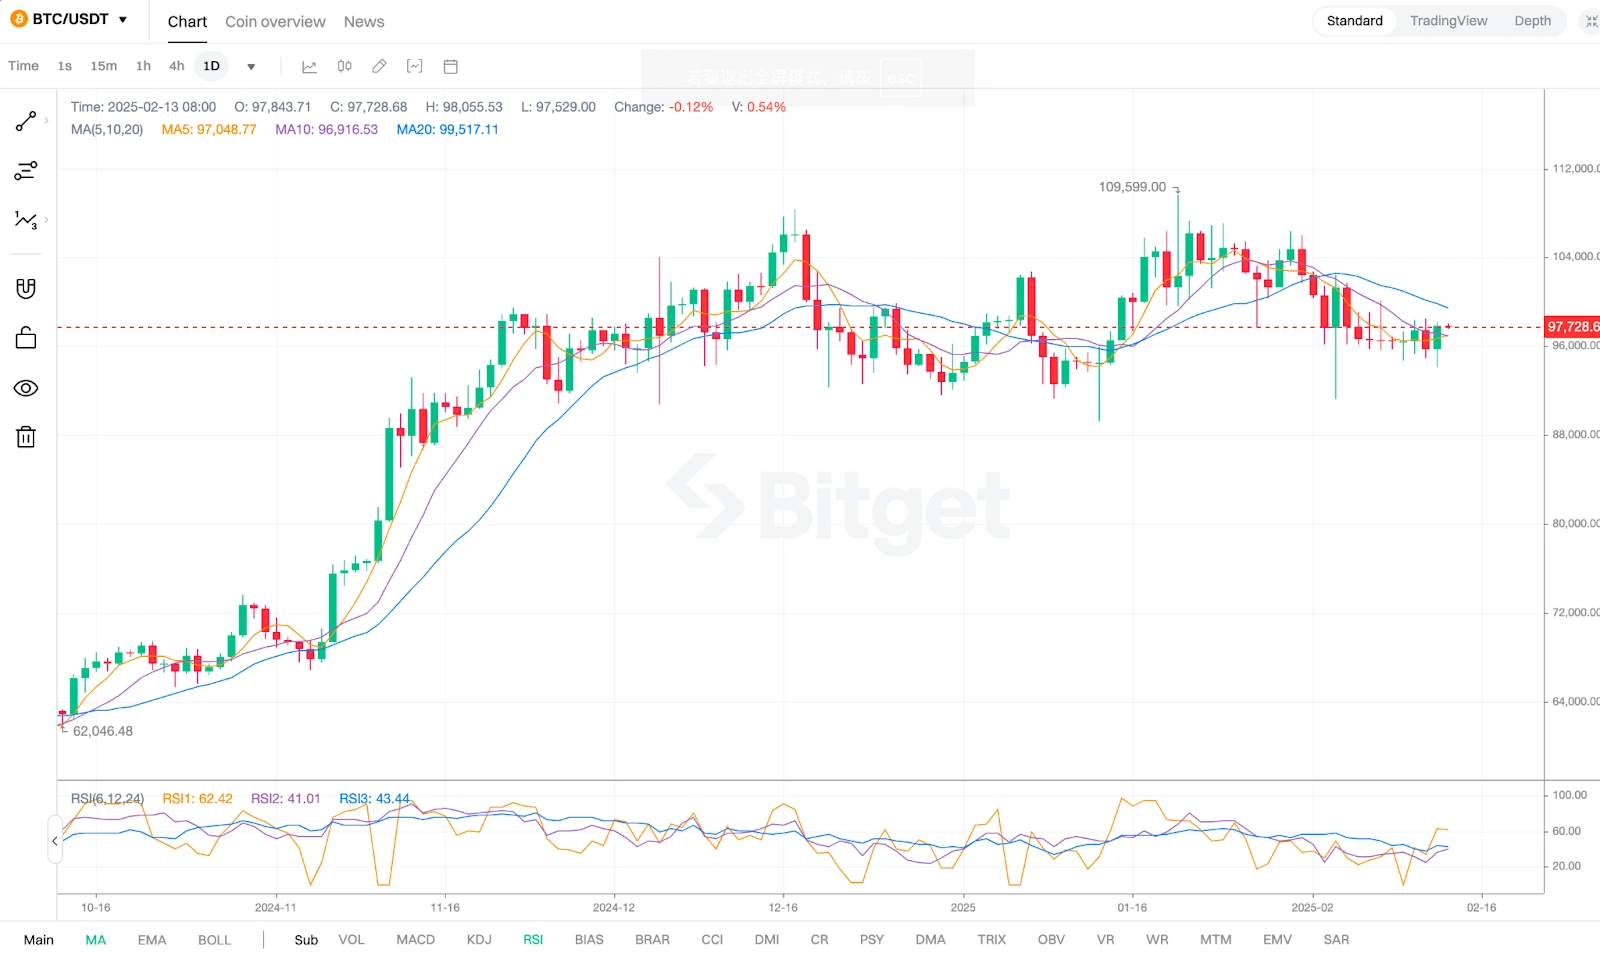
(Source: Bitget)
Comprehensive Technical Analysis
Short-term perspective shows current technical indicators suggest the market remains in an adjustment phase with strong bearish momentum. Bitcoin price might test support levels at $92,000 and $89,000.
Long-term perspective, based on indicators like the 52-week SMA and MVRV Z-Score, suggests Bitcoin retains significant upward potential, with the current pullback possibly representing a normal bull market correction.
FEDERAL RESERVE INTEREST RATE AND BALANCE SHEET DATA: BULL MARKET EXPLOSION NEEDS TIME
The Fed’s monetary policy fundamentally impacts the crypto market. Looking back, why has this halving rally been so challenging? Why has only Bitcoin consistently reached new highs while altcoins keep hitting new lows?
The root cause is lack of money in the market! As previously discussed, the bull market logic requires continuous inflow of new capital, but currently, the market’s biggest money spigot – the Federal Reserve – remains in a semi-closed state:
On one hand, although the Fed implemented three rate cuts totaling 100 basis points in 2024, current rates remain at 4.25-4.50%. The Fed’s neutral rate is generally considered to be between 2.5-3%, a level deemed neither stimulative nor restrictive to economic growth. This indicates current rates remain high, preventing market liquidity from rising.
On February 12th, following the higher-than-expected U.S. January core inflation data, U.S. bond traders pushed back their estimates for the next Fed rate cut from mid-year to December.
Also on the 12th, Fed Chairman Powell, during his semi-annual monetary policy testimony before the Senate Banking, Housing and Urban Affairs Committee, stated there’s no rush to adjust rates, maintaining the 2% inflation target.
Fed Interest Rate Changes Over Past 5 Years
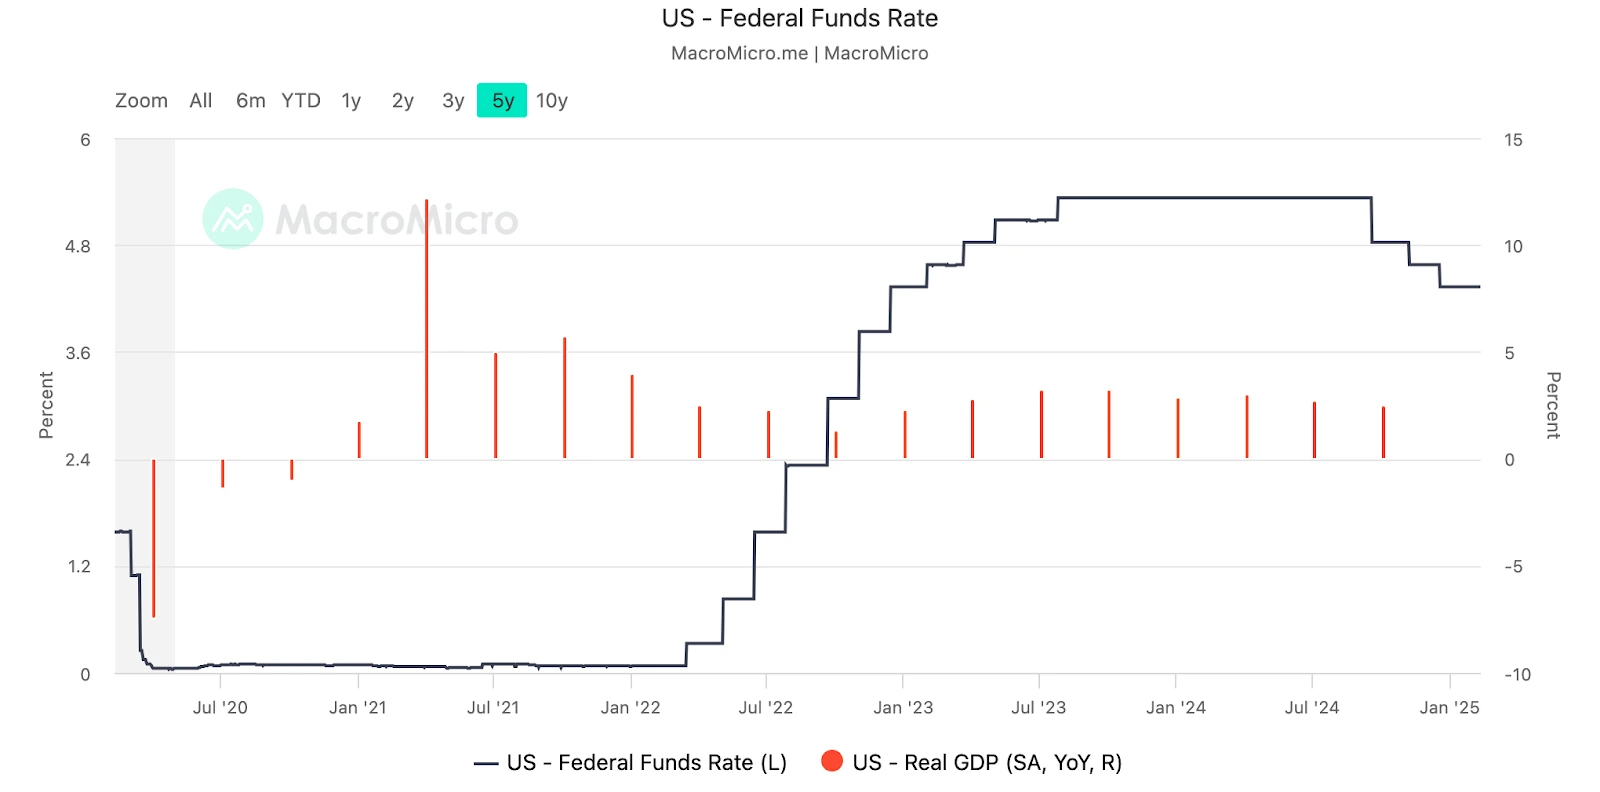
(Source: MacroMicro)
On the other hand, while the Fed has begun cutting rates, it continues balance sheet reduction. Since 2022 through the end of last year, the Fed has reduced its balance sheet by nearly $2 trillion (as shown in the chart below). Balance sheet reduction typically has a more direct and obvious effect on market liquidity compression, as it directly reduces Fed asset purchases or reinvestment, fundamentally reducing market cash flow.
The latest news is that Powell indicated the Fed will continue reducing its securities holdings, which is unfavorable for crypto market expansion.
Fed Balance Sheet Size
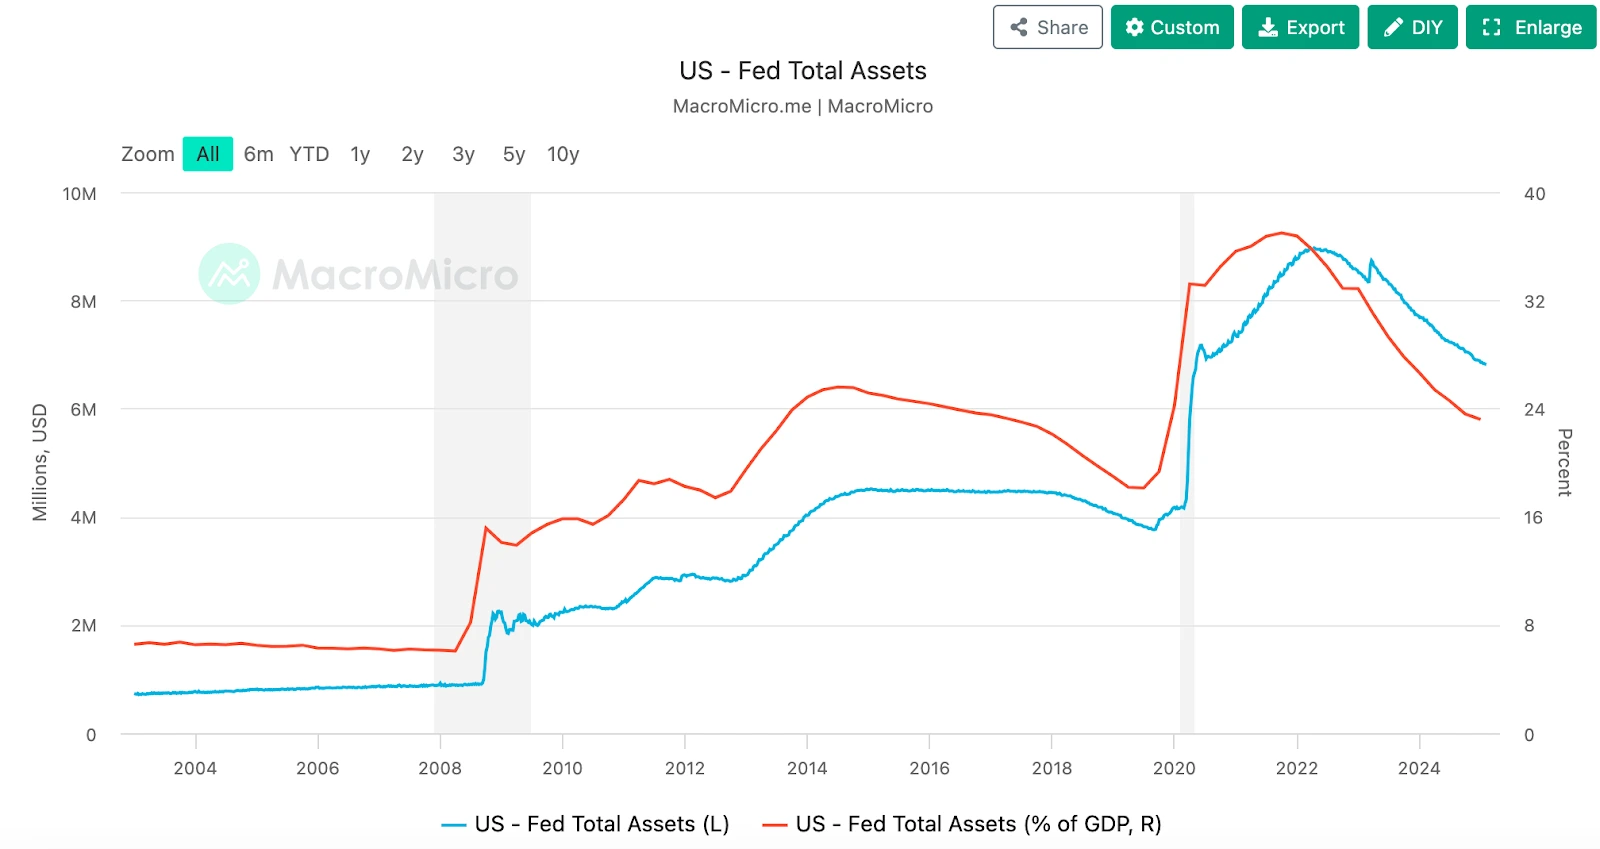
(Source: MacroMicro)
Comprehensive outlook suggests the market currently severely lacks liquidity, insufficient for sustained upward movement. The only new money comes from Bitcoin spot ETFs, which is only enough to push up Bitcoin and some battle-tested mainstream coins like XRP, LTC, and DOGE.
Of course, current market weakness has another reason worth mentioning: there are too many altcoins. Currently, CoinMarketCap lists over 11 million tokens – how can the market support them all? This likely exceeds the total number of stocks in all global stock markets combined!
Regarding two fundamental questions about this halving cycle:
- When will this halving bull market resume growth?
- What conditions are needed for altcoin season?
Both depend on Fed rate and balance sheet policy changes.
For example, market growth could resume if the Fed restarts rate cuts and stops balance sheet reduction. If the Fed continues cutting rates below 3%, reaching at least the neutral rate level of 2.5-3%, and then begins balance sheet expansion, fundamental conditions for altcoin season would be met.
In conclusion, while the market appears to have reached a short-term cyclical bottom with possible further testing of lows, the probability of a rebound is significantly higher. However, from a medium to long-term perspective, the market may need continued consolidation. Under current conditions of Fed rate hike pause, high interest rates, and insufficient market liquidity, significant performance may be difficult to achieve.
▶ Buy Crypto at Bitget
CoinRank x Bitget – Sign up & Trade to get $20!