


KEYTAKEAWAYS
- Understanding and using technical indicators is crucial for successful crypto trading.
- The article covers the top 10 indicators, including Moving Averages, RSI, and MACD.
- KEY TAKEAWAYS
- INTRODUCTION
- WHAT ARE TECHNICAL INDICATORS?
- TYPES OF CRYPTO INDICATORS
- 1. MOVING AVERAGE (MA)
- 2. RELATIVE STRENGTH INDEX (RSI)
- 3. MOVING AVERAGE CONVERGENCE DIVERGENCE (MACD)
- 4. BOLLINGER BANDS
- 5. STOCHASTIC OSCILLATOR
- 6. FIBONACCI RETRACEMENT
- 7. ICHIMOKU CLOUD
- 8. AVERAGE DIRECTIONAL INDEX (ADX)
- 9. VOLUME
- 10. PARABOLIC SAR (STOP AND REVERSE)
- CONCLUSION
- FAQs
- DISCLAIMER
- WRITER’S INTRO
CONTENT
Explore the top 10 technical indicators for crypto trading in 2024, including Moving Averages, RSI, MACD, and more. Learn how to use these tools to analyze market trends, identify potential reversals, and optimize your trading strategy.
INTRODUCTION
The world of cryptocurrency trading is dynamic and fast-paced, requiring traders to stay ahead of market trends to maximize their profits. Technical indicators are essential tools that traders use to analyze price movements, predict future trends, and make informed decisions. In 2024, as the cryptocurrency market continues to evolve, understanding and effectively using these technical indicators is crucial. This article explores the top 10 technical indicators for crypto trading, providing detailed explanations, advantages, and practical tips on how to use them.
>> Also read:
WHAT ARE TECHNICAL INDICATORS?
Technical indicators are mathematical tools that traders use to analyze financial markets, including the highly dynamic cryptocurrency market. These indicators utilize historical price and volume data to uncover trends, patterns, and potential future price movements. Technical indicators are generally categorized into two types:
- Leading Indicators: These indicators predict future price movements based on current market conditions, operating on the principle that historical patterns tend to repeat themselves. They provide early signals of possible trend reversals or continuations.
- Lagging Indicators: These indicators are based on historical market data and confirm trends that have already occurred. They rely on the concept that past price actions often follow cyclical patterns.
TYPES OF CRYPTO INDICATORS
Crypto trading indicators are categorized based on their ability to identify, measure, or confirm specific aspects of price performance. The key types include:
- Trend Indicators: These indicators help traders determine the direction of a market trend, evaluate its strength, and identify potential trend reversals.
- Momentum/Oscillator Indicators: These indicators measure the rate of price change over a specified period, helping to assess the strength of a trend and potential reversals.
- Volume Indicators: Volume indicators analyze the trading volume of a cryptocurrency over a given period, confirming trends and identifying potential reversals and breakouts.
- Volatility Indicators: These indicators measure the extent of price fluctuations within a specific period, identifying potential trend reversals, market tops or bottoms, and assessing associated risk levels.
- Support and Resistance Levels: Understanding support and resistance levels is crucial for making informed trading decisions. Support levels are zones where prices have consistently bounced to new highs, while resistance levels indicate where prices have faced pullbacks after reaching highs.
1. MOVING AVERAGE (MA)
Overview:
The Moving Average (MA) is one of the most fundamental and widely used technical indicators in crypto trading. It smooths out price data to create a constantly updated average price, helping traders identify the direction of the trend over a specific period.
Types:
- Simple Moving Average (SMA): Calculated by adding the prices over a certain period and dividing by the number of periods. It provides a straightforward average of prices over a given timeframe.
- Exponential Moving Average (EMA): Unlike SMA, the EMA gives more weight to recent prices, making it more responsive to new information. This can be particularly useful in fast-moving markets like crypto.
Advantages:
- Helps in identifying the overall trend direction (uptrend, downtrend, or sideways).
- Useful in determining support and resistance levels, which can act as potential entry or exit points.
How to Use:
Traders often use crossovers of short-term and long-term MAs as buy or sell signals. For example, when a short-term MA (e.g., 50-day) crosses above a long-term MA (e.g., 200-day), it may signal a buy opportunity, commonly known as a “golden cross.” Conversely, a “death cross” occurs when a short-term MA crosses below a long-term MA, signaling a potential sell.
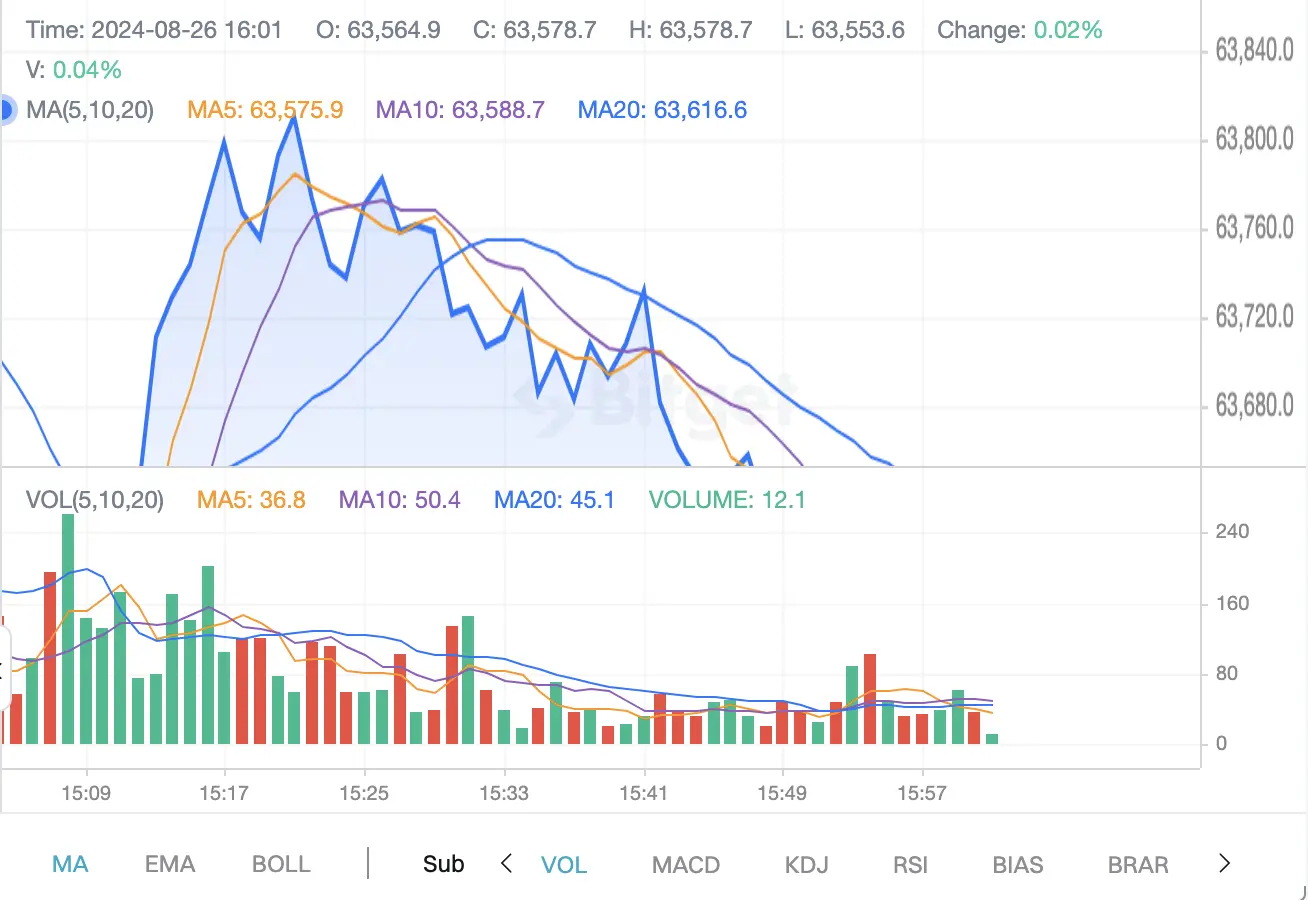
(Source: Bitget website)
2. RELATIVE STRENGTH INDEX (RSI)
Overview:
The Relative Strength Index (RSI) is a momentum oscillator that measures the speed and change of price movements. It provides insights into overbought or oversold conditions in the market.
Advantages:
- Helps in identifying potential reversal points where the market may change direction.
- Useful in confirming trends, particularly when used in conjunction with other indicators.
How to Use:
RSI is measured on a scale from 0 to 100. An RSI value above 70 indicates that the asset is overbought and might be due for a price correction, suggesting a potential sell signal. Conversely, an RSI below 30 indicates that the asset is oversold, potentially signaling a buying opportunity.
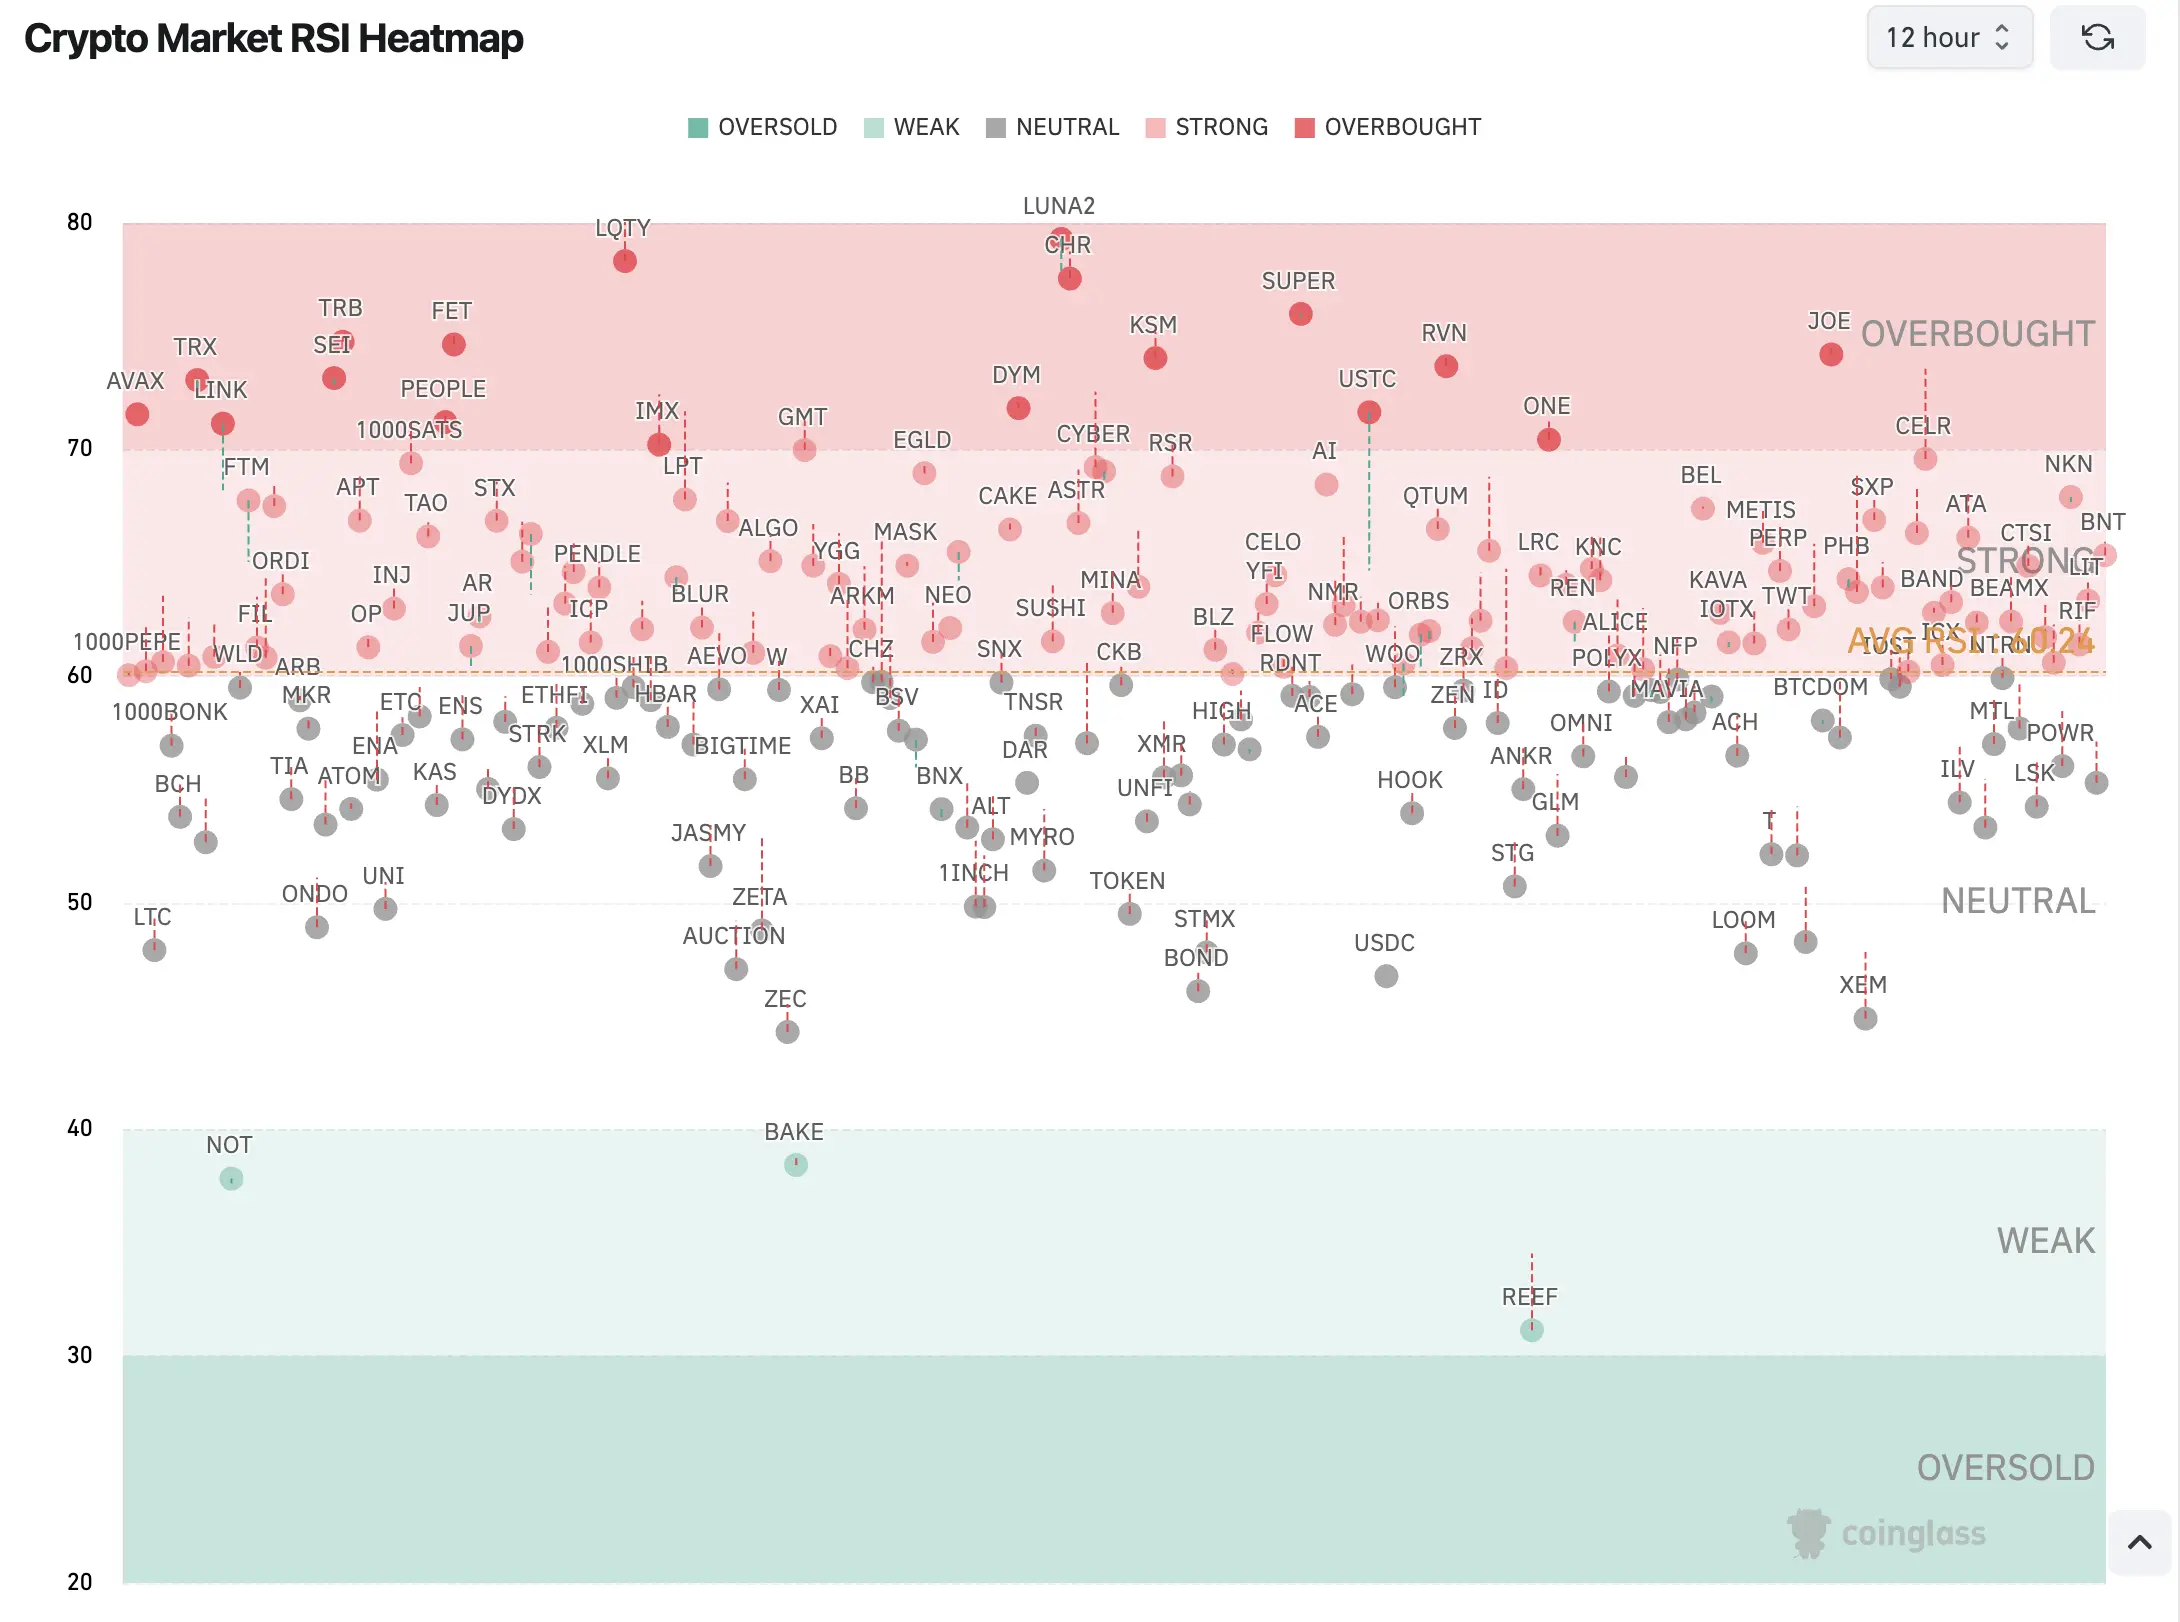
(Source: Coinglass)
>> Read more: What Is RSI, and How Do You Use It in the Crypto Market?
3. MOVING AVERAGE CONVERGENCE DIVERGENCE (MACD)
Overview:
The Moving Average Convergence Divergence (MACD) is a trend-following indicator that shows the relationship between two moving averages of a security’s price. It helps traders understand the strength and direction of a trend.
Components:
- MACD Line: The difference between the 12-day and 26-day EMA.
- Signal Line: A 9-day EMA of the MACD Line, used to generate buy or sell signals.
- Histogram: The difference between the MACD Line and the Signal Line, indicating momentum.
Advantages:
- Helps in identifying changes in momentum, signaling potential buy and sell opportunities.
- Useful in spotting divergence between price and MACD, which can indicate a potential reversal.
How to Use:
A bullish signal is generated when the MACD Line crosses above the Signal Line, indicating a potential buying opportunity. A bearish signal occurs when the MACD Line crosses below the Signal Line, suggesting it may be time to sell.
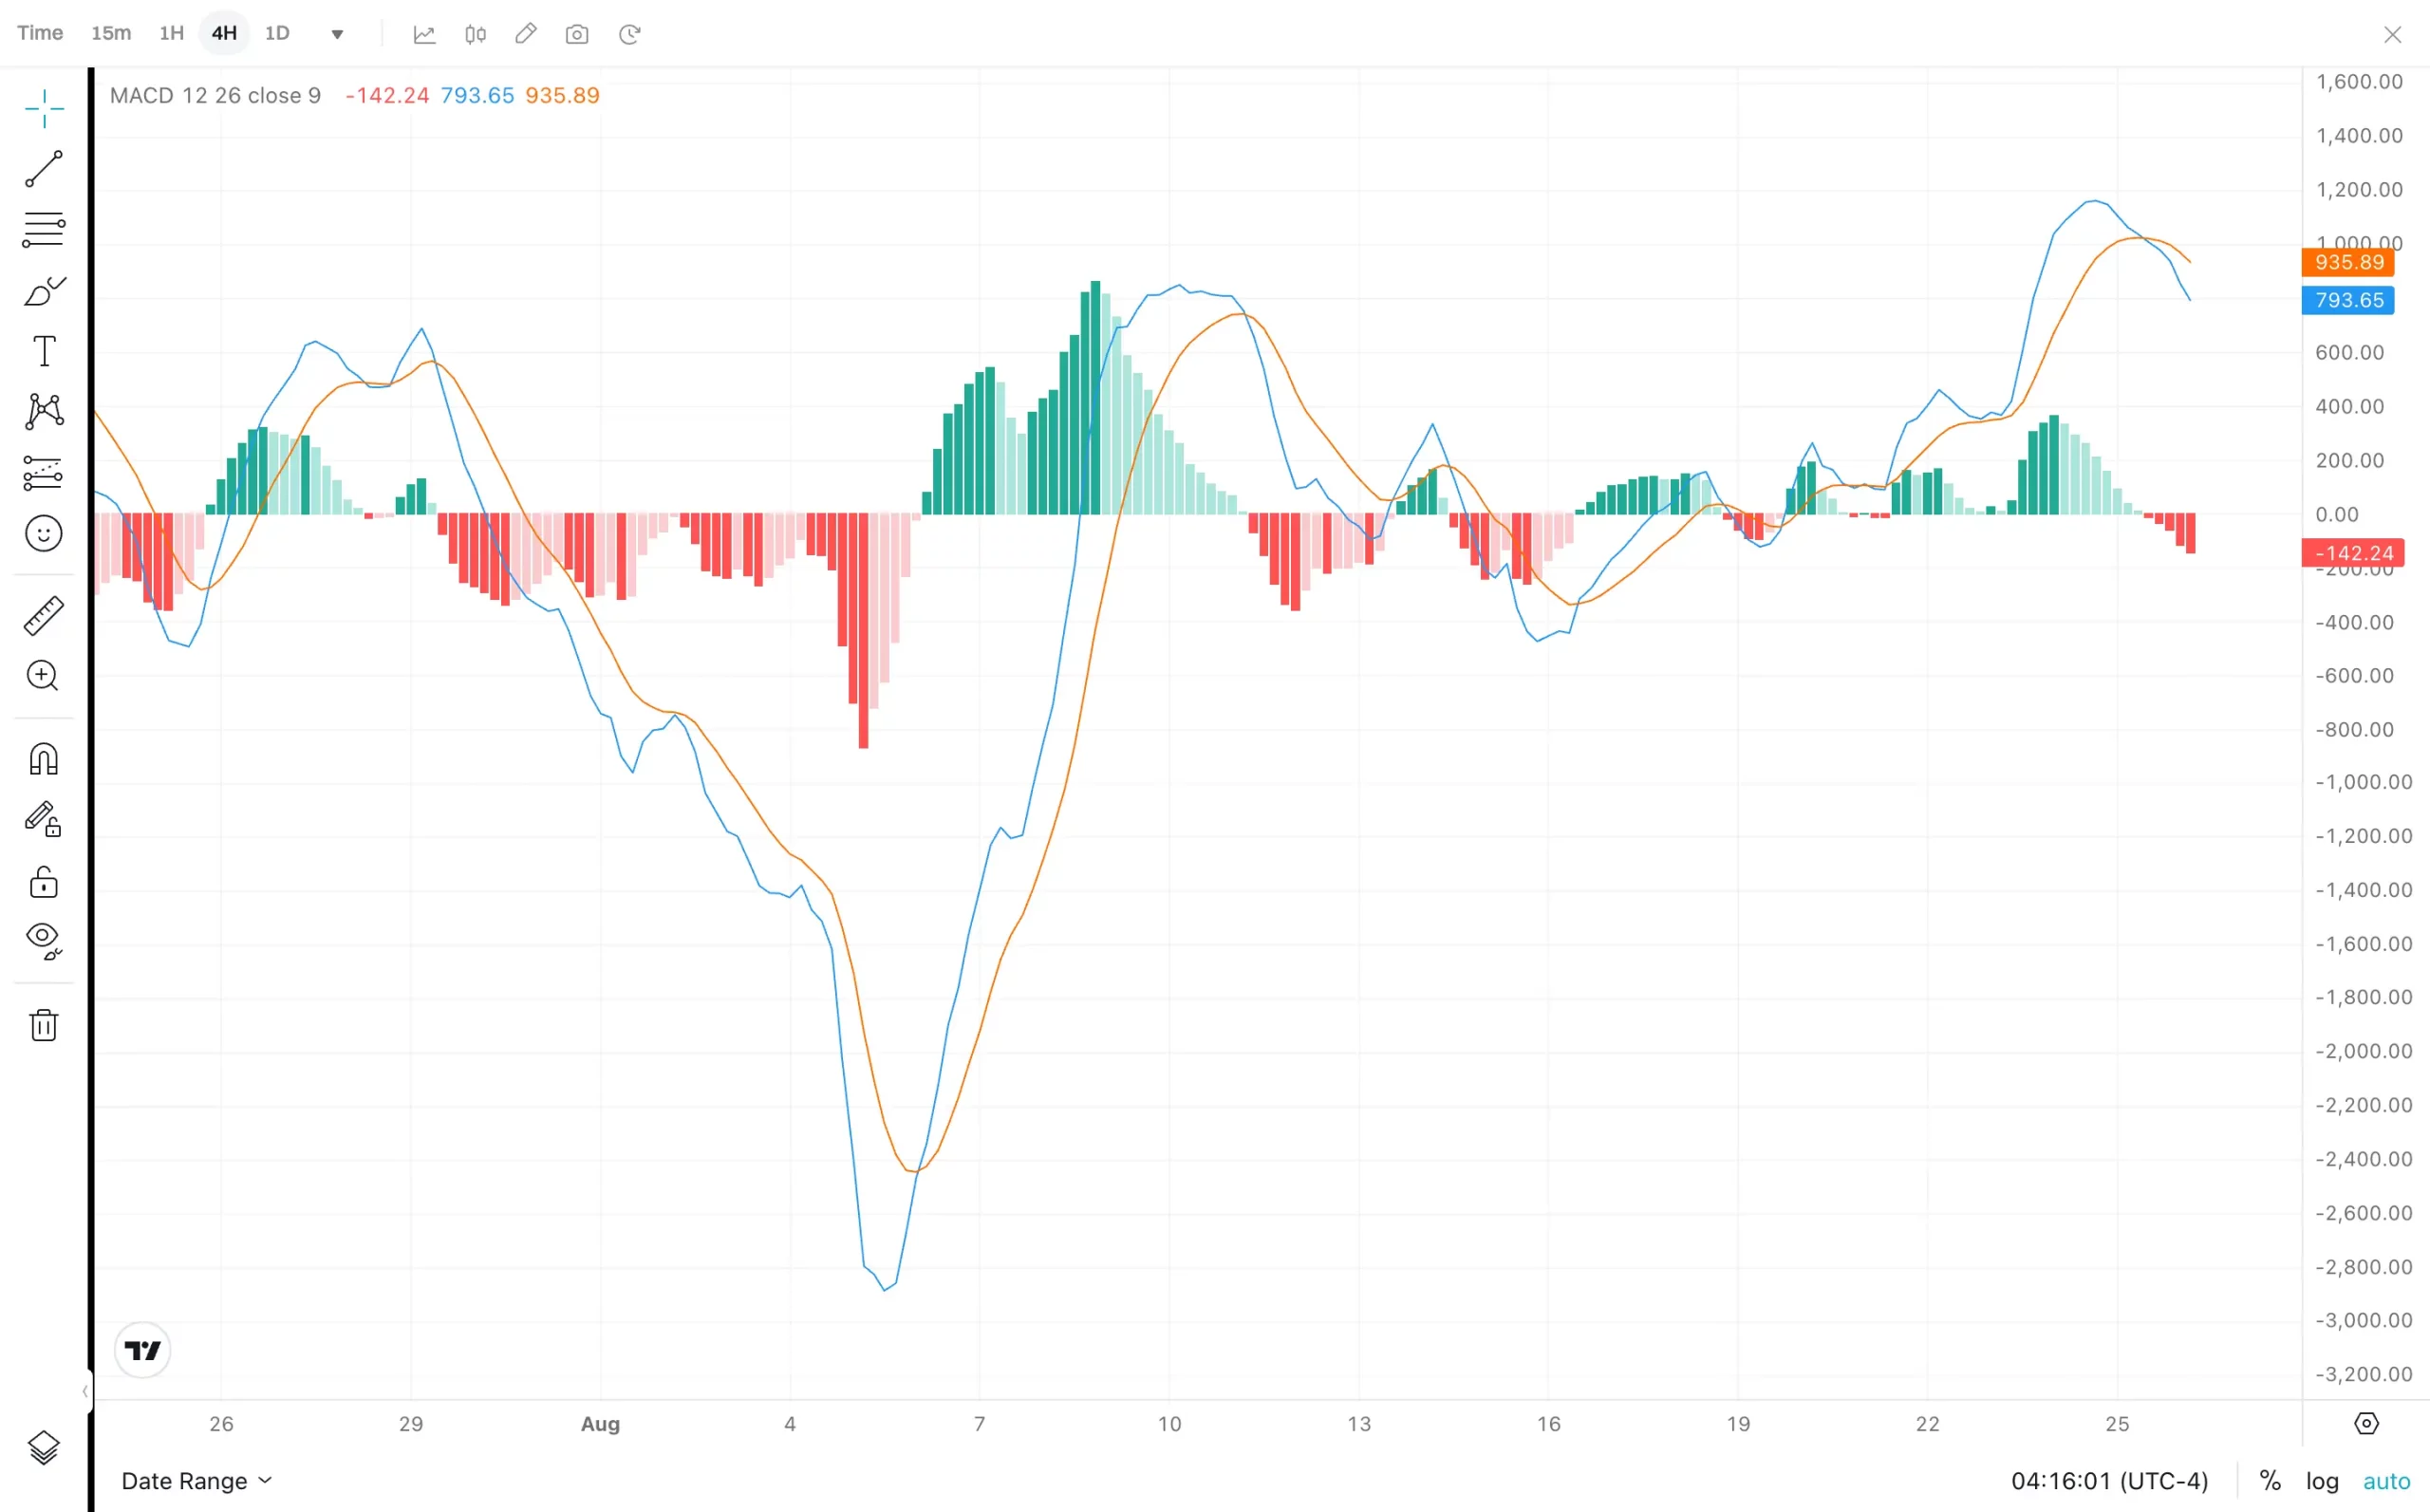
(Source: Bitget)
>> Also read: What Is MACD? How It Works in Crypto Trading
4. BOLLINGER BANDS
Overview:
Bollinger Bands consist of a middle band (typically a 20-day SMA) and two outer bands that are standard deviations away from the middle band. These bands expand and contract based on market volatility.
Advantages:
- Helps identify overbought or oversold conditions by showing how far prices deviate from the average.
- Useful in detecting volatility and potential price breakouts, as the bands tend to widen during periods of high volatility and contract during periods of low volatility.
How to Use:
Traders often buy when the price touches the lower Bollinger Band, expecting it to revert to the mean, and sell when it touches the upper band. Bollinger Bands can also be used in conjunction with other indicators like RSI to confirm signals.
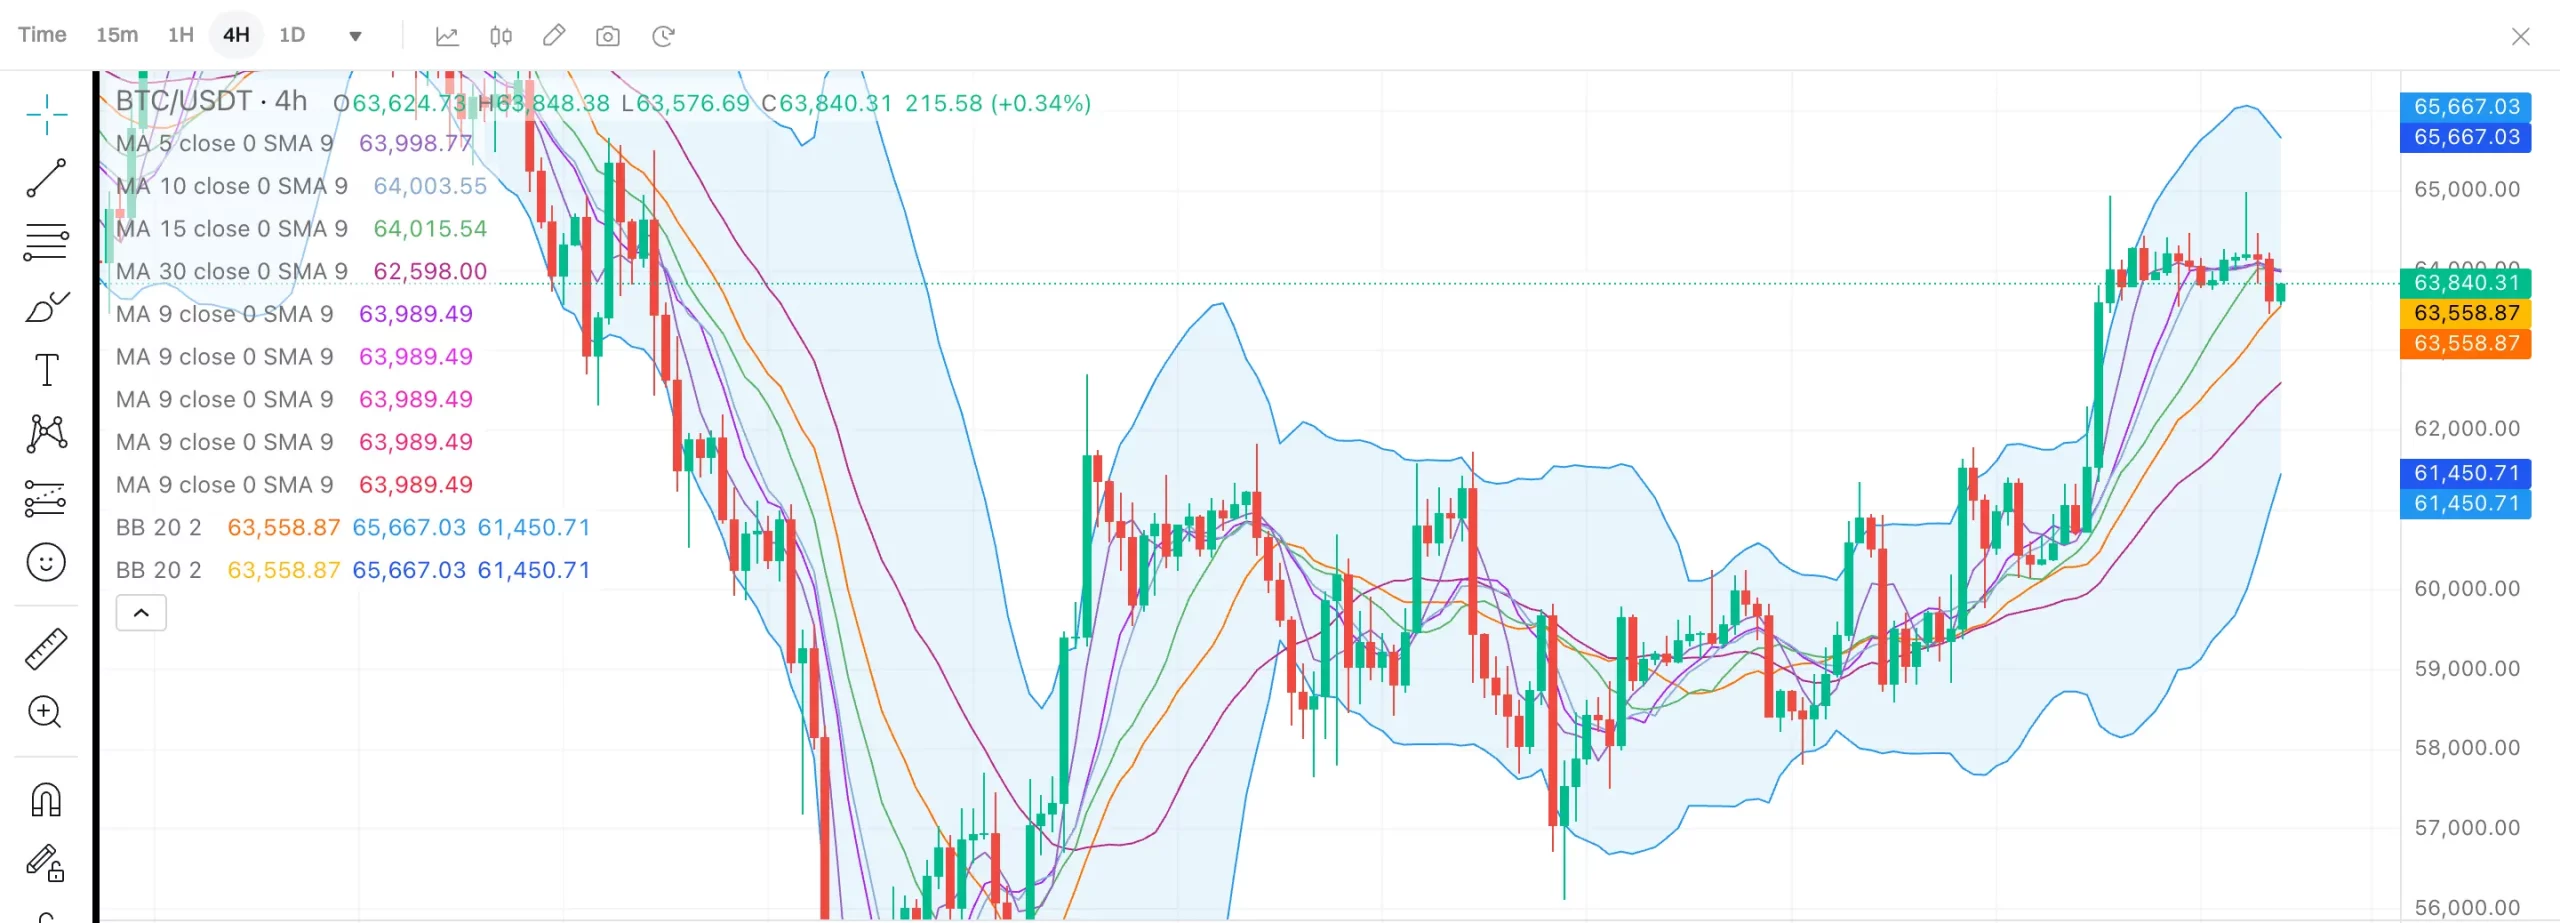
(Source: Bitget website)
5. STOCHASTIC OSCILLATOR
Overview:
The Stochastic Oscillator is a momentum indicator that compares a specific closing price to a range of its prices over a certain period. It is used to determine whether an asset is overbought or oversold.
Advantages:
- Identifies overbought and oversold levels, which can be key signals for potential market reversals.
- Useful in predicting trend reversals by highlighting potential exhaustion points in the current trend.
How to Use:
The Stochastic Oscillator is plotted on a scale of 0 to 100. Readings above 80 indicate overbought conditions, while readings below 20 indicate oversold conditions. Traders typically look for crossover signals when the %K line crosses the %D line, particularly in overbought or oversold regions.
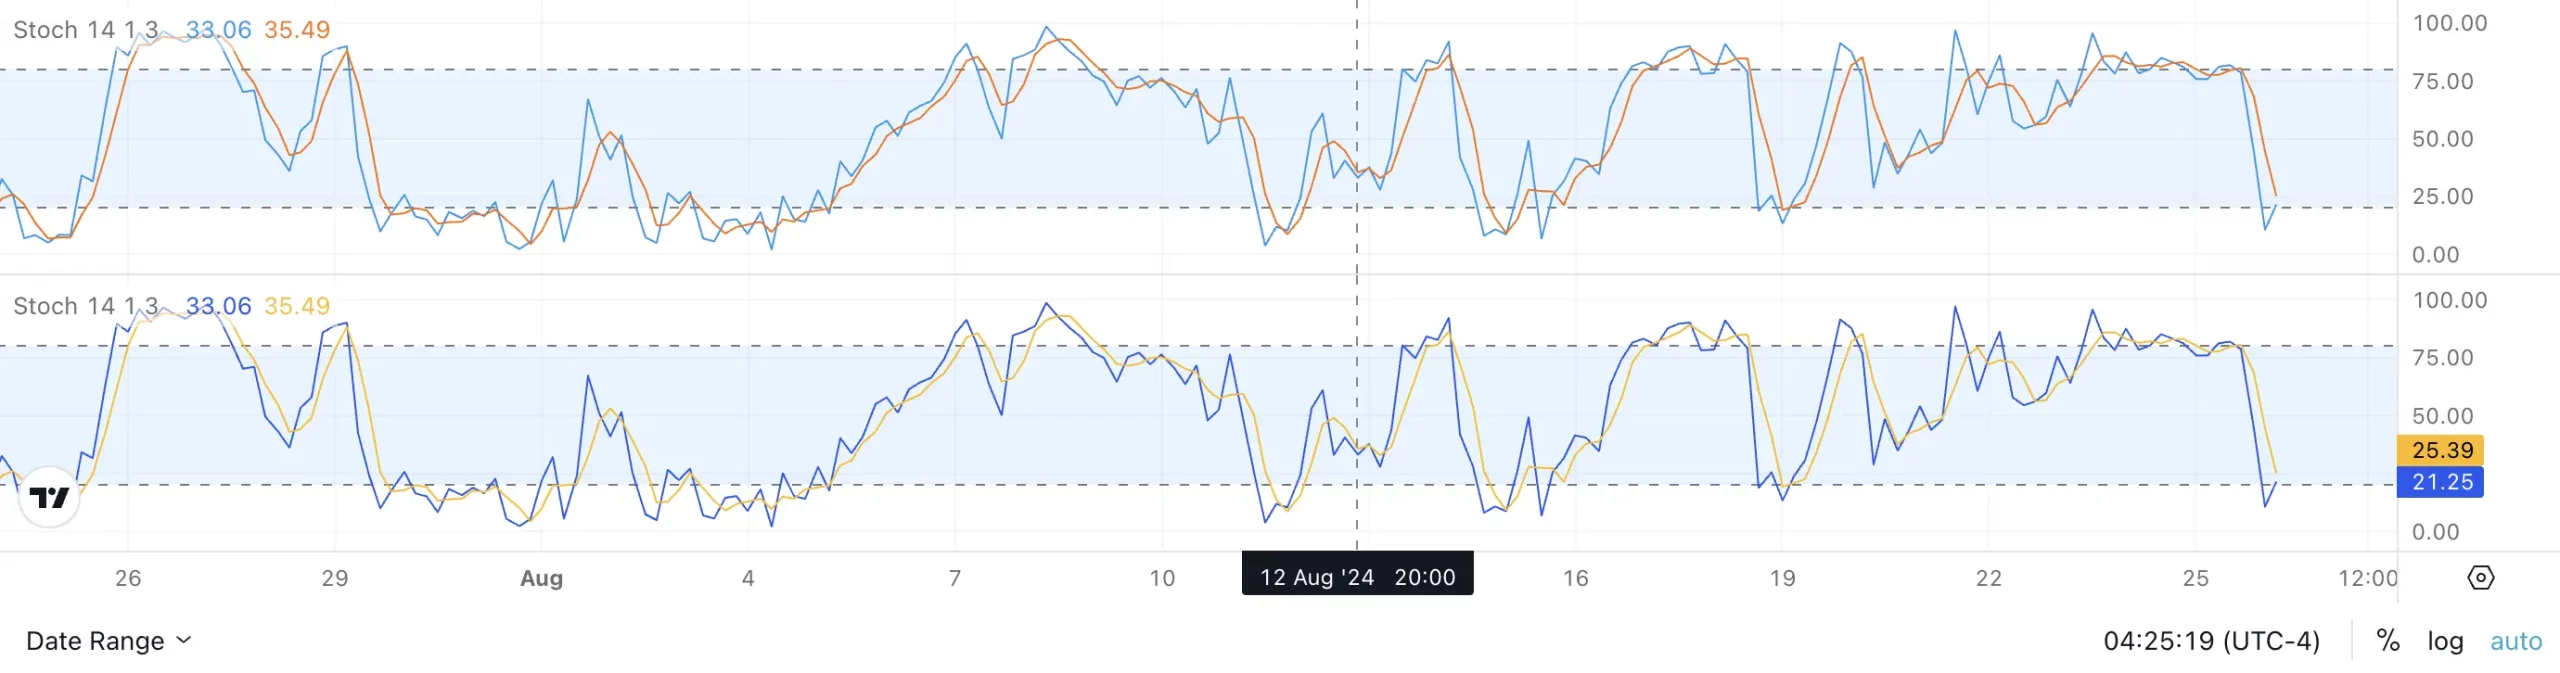
(Source: Bitget website)
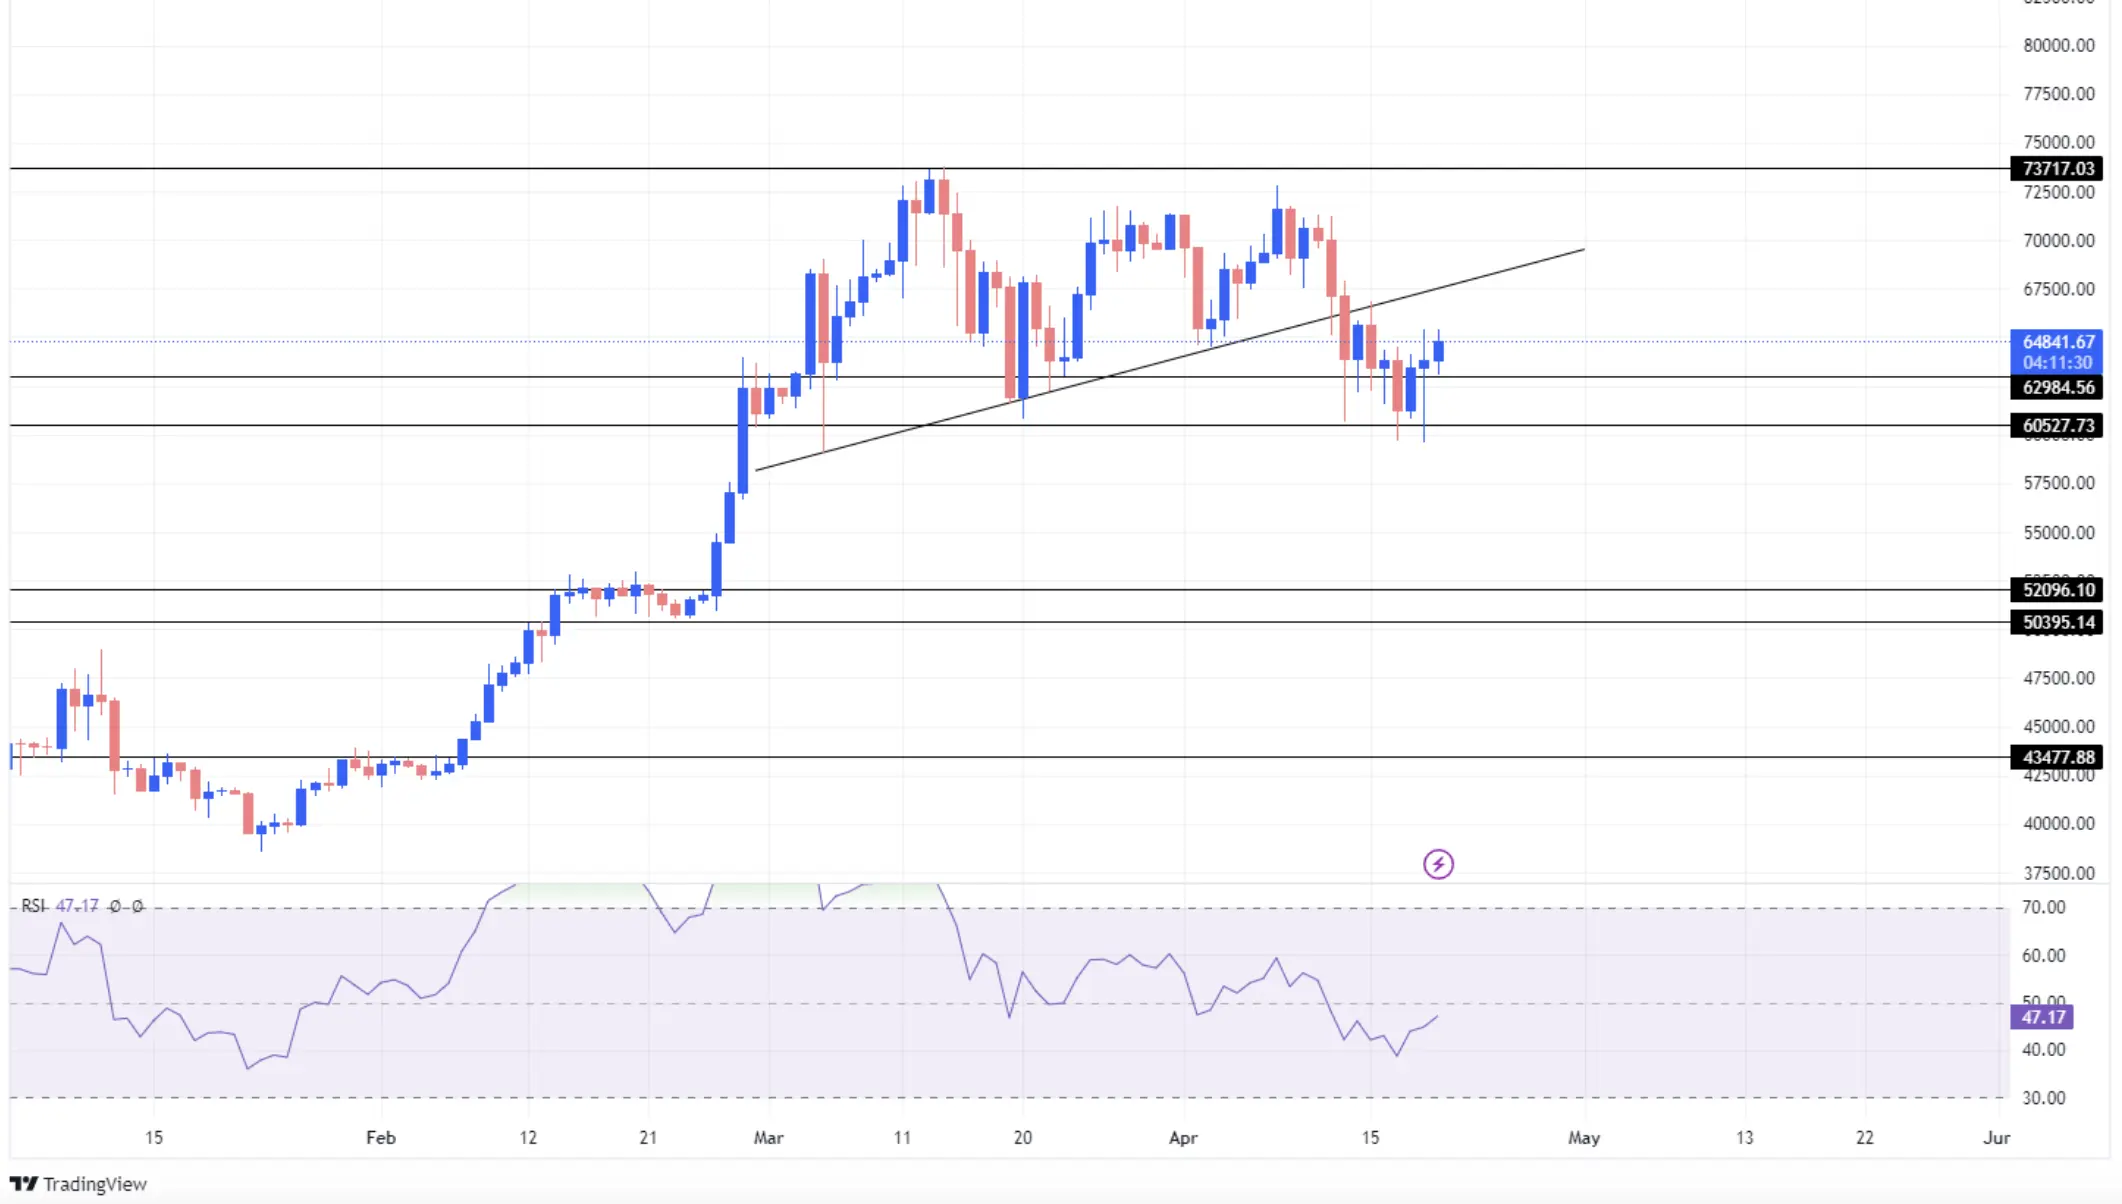
6. FIBONACCI RETRACEMENT
Overview:
Fibonacci Retracement levels are horizontal lines that indicate potential support and resistance levels where a price may reverse direction. These levels are based on the Fibonacci sequence, a mathematical pattern found in nature.
Advantages:
- Helps identify potential reversal points, making it a popular tool for predicting where the market might pull back or advance.
- Widely used to determine entry and exit points during a trend, particularly during pullbacks.
How to Use:
Common Fibonacci retracement levels include 38.2%, 50%, and 61.8%. Traders use these levels to predict how far a price might retrace before continuing its original trend. For example, if a cryptocurrency is in an uptrend, a pullback to the 61.8% retracement level may be seen as a buying opportunity.
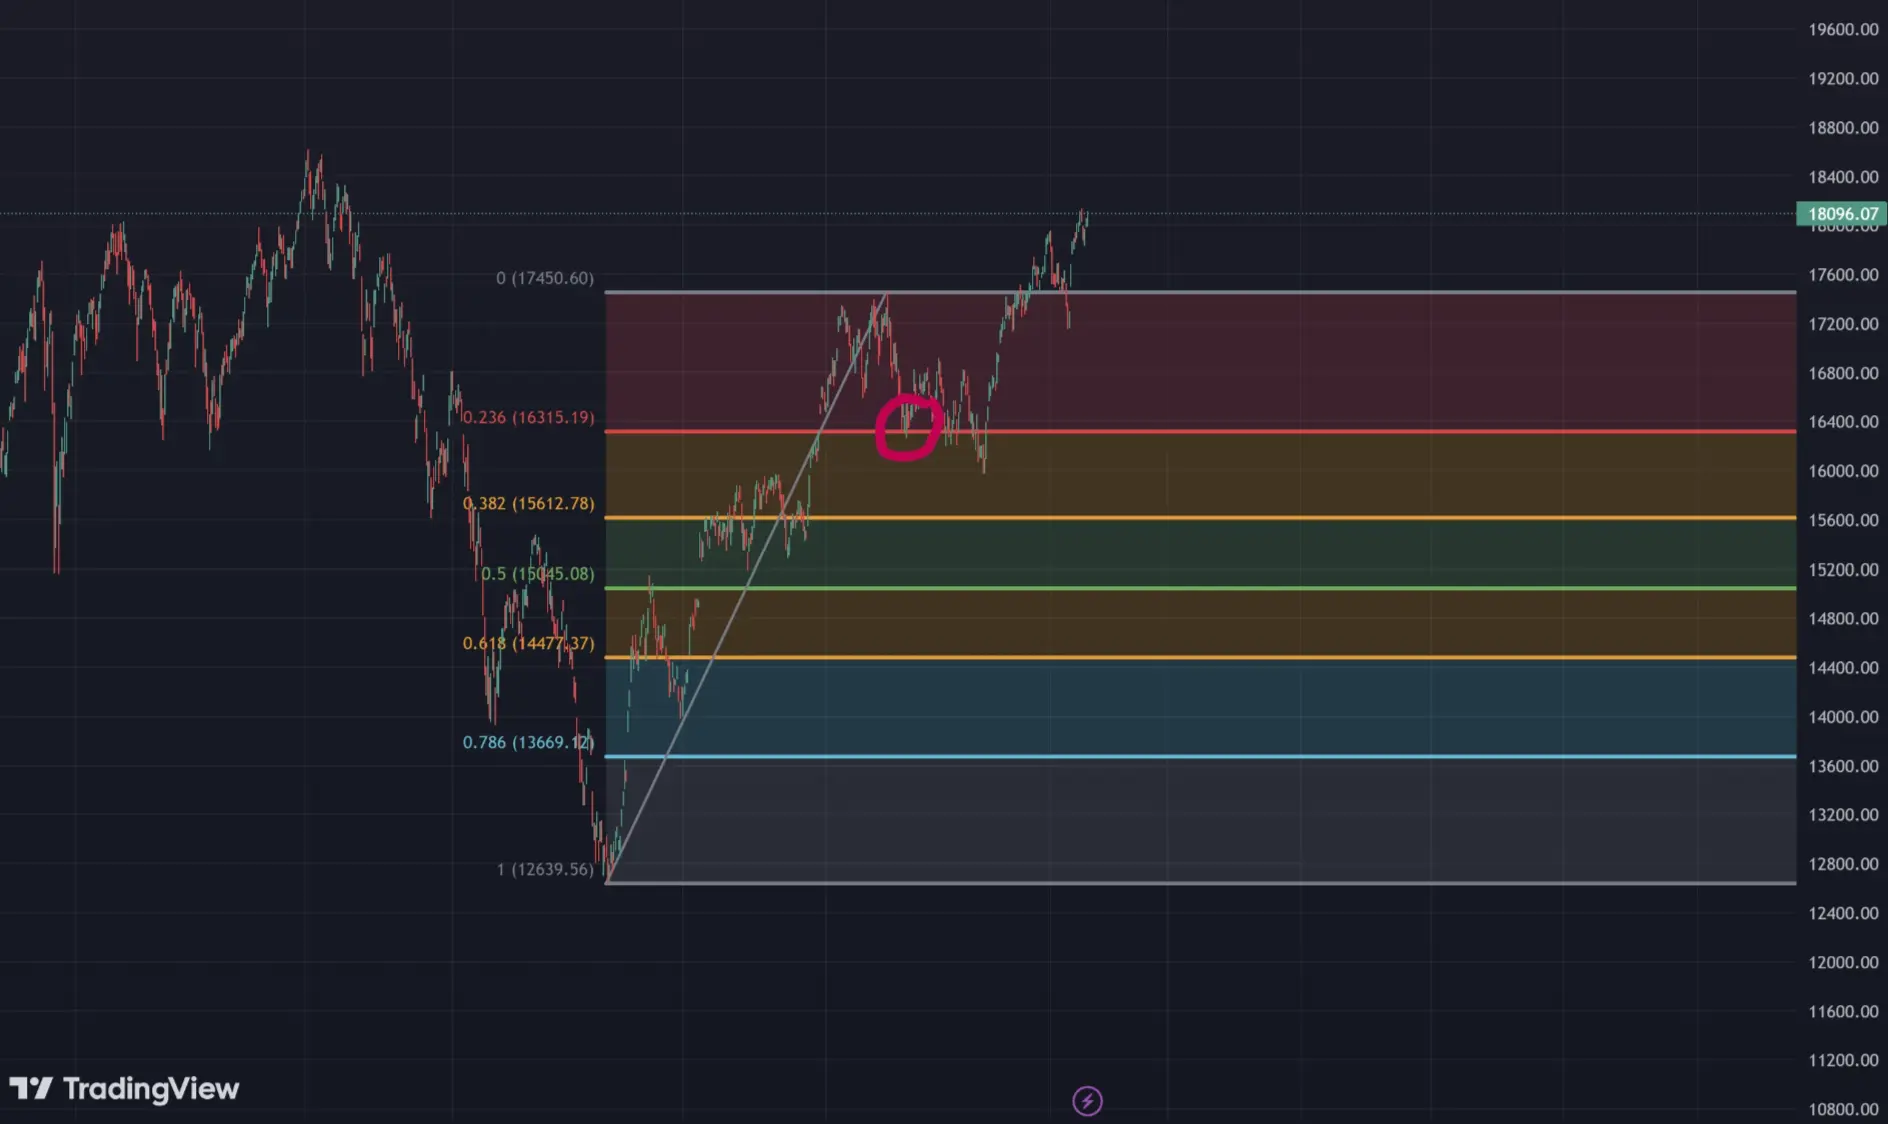
(Source: TradingView)
7. ICHIMOKU CLOUD
Overview:
The Ichimoku Cloud, also known as Ichimoku Kinko Hyo, is a comprehensive indicator that provides information on support and resistance levels, momentum, and trend direction in a single view.
Components:
- Tenkan-sen (Conversion Line): Represents the short-term trend.
- Kijun-sen (Base Line): Represents the medium-term trend.
- Senkou Span A & B (Leading Spans): These form the cloud, which forecasts potential future support and resistance levels.
Advantages:
- Offers a full picture of the market’s condition, helping traders understand the overall trend, momentum, and potential reversal points.
- Useful in identifying trend strength and direction, with the cloud itself acting as a support or resistance area.
How to Use:
When the price is above the cloud, it’s generally considered to be in a bullish trend, and when it’s below the cloud, it’s in a bearish trend. The thickness of the cloud can also indicate the strength of the support or resistance.
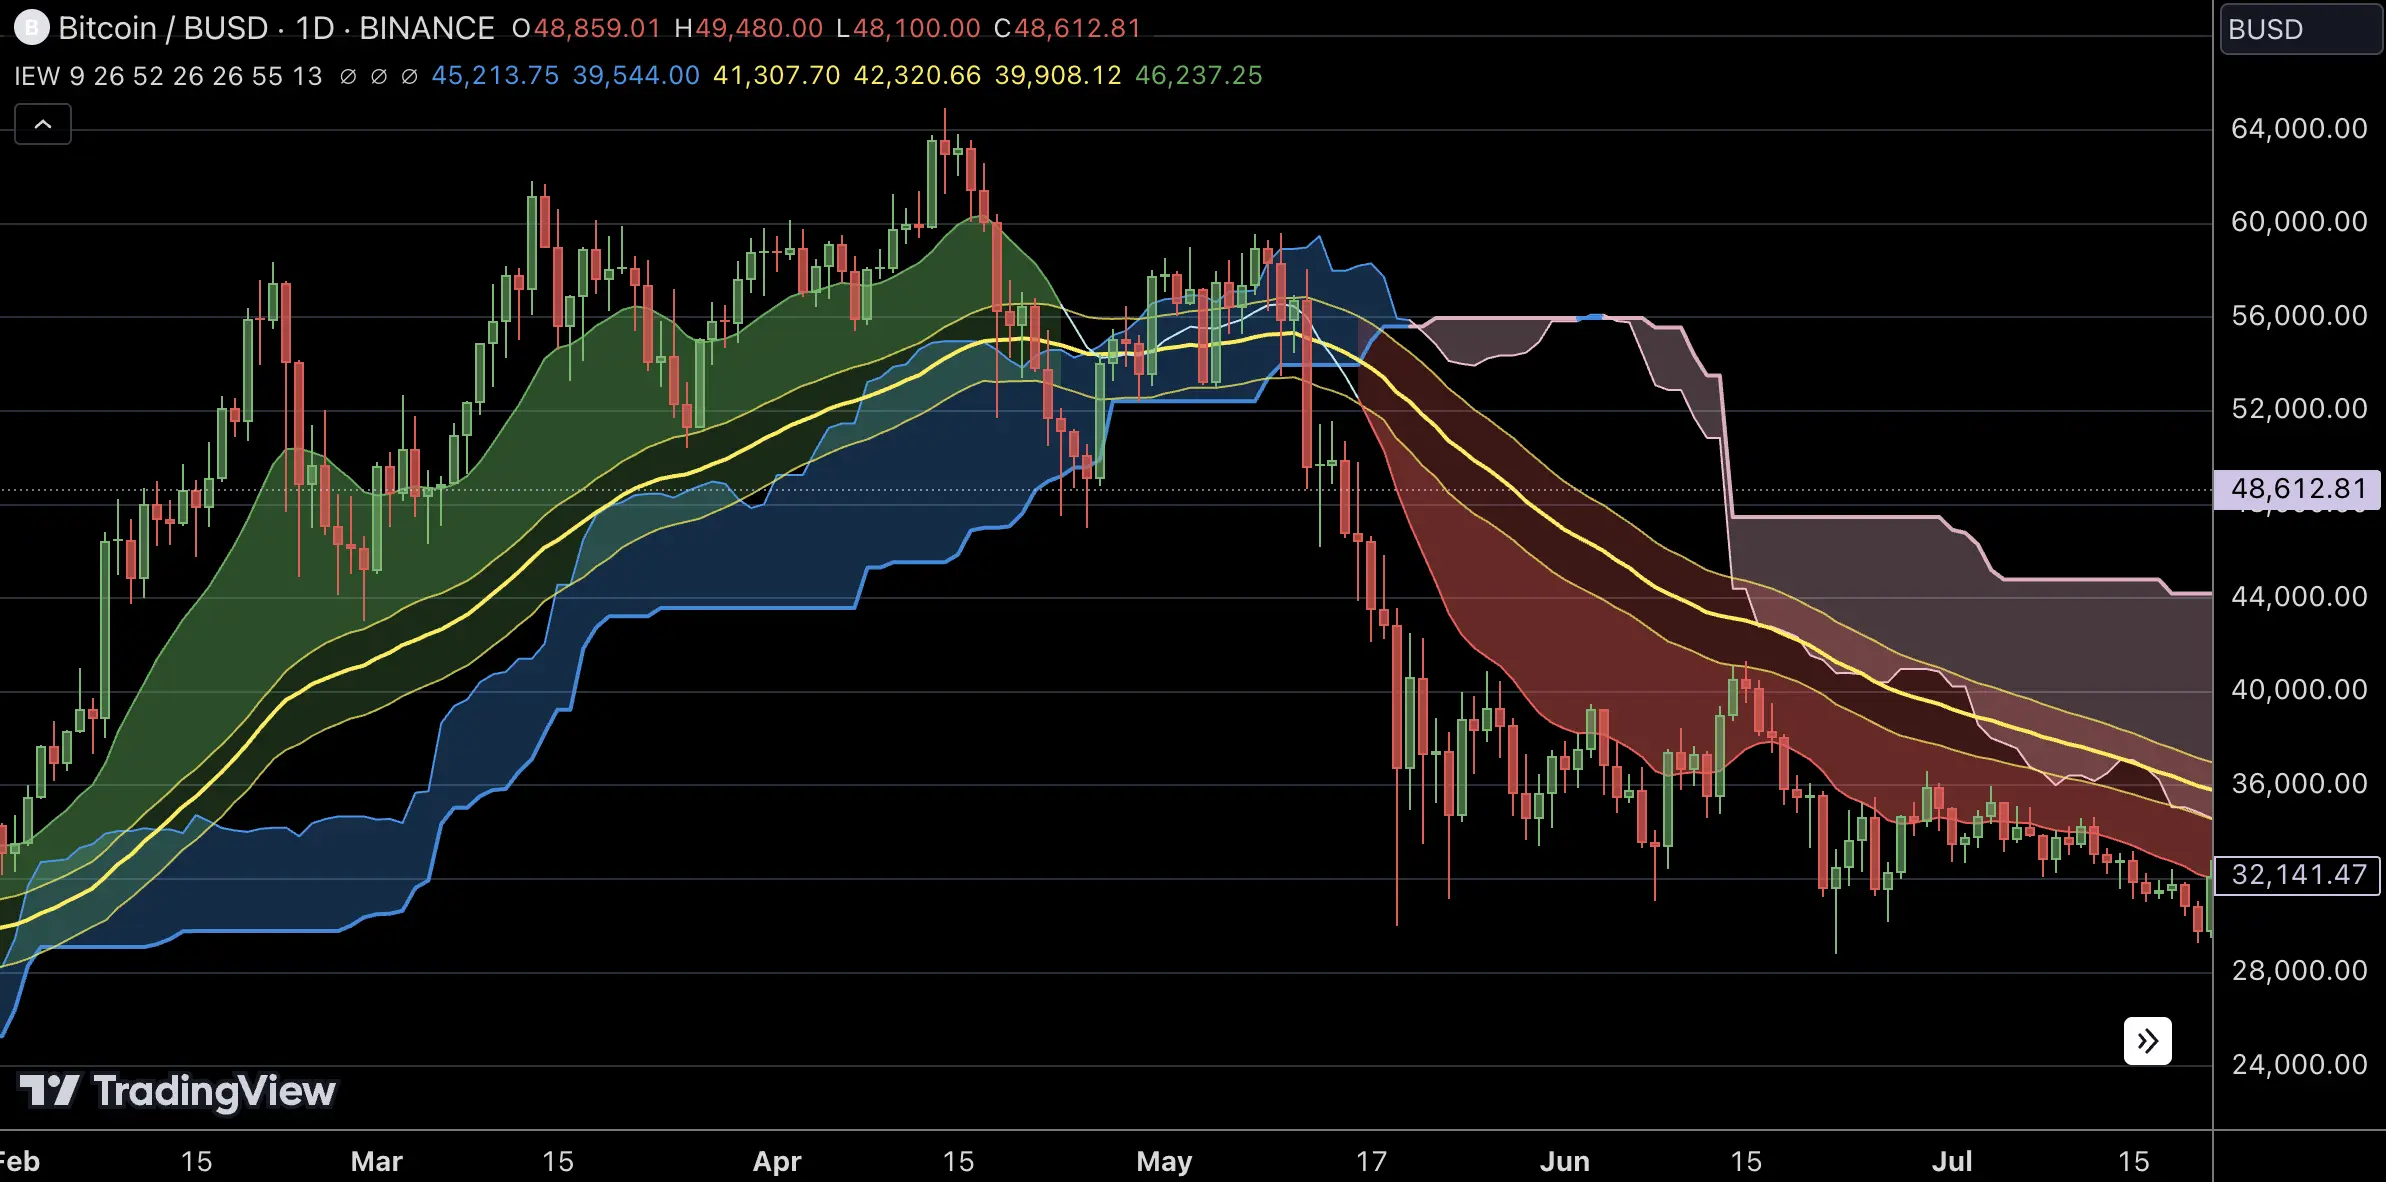
(Source: TradingView)
8. AVERAGE DIRECTIONAL INDEX (ADX)
Overview:
The Average Directional Index (ADX) is an indicator that measures the strength of a trend, helping traders determine whether the market is trending or ranging.
Advantages:
- Helps confirm trend strength, allowing traders to focus on trending markets rather than choppy, range-bound conditions.
- Useful in determining the best trading strategy—whether to follow the trend or to engage in range trading.
How to Use:
An ADX value above 25 typically indicates a strong trend, while a value below 20 suggests a weak trend or a range-bound market. ADX doesn’t indicate the direction of the trend, just the strength, so it’s often used in conjunction with other indicators to confirm the market conditions and inform trading decisions.
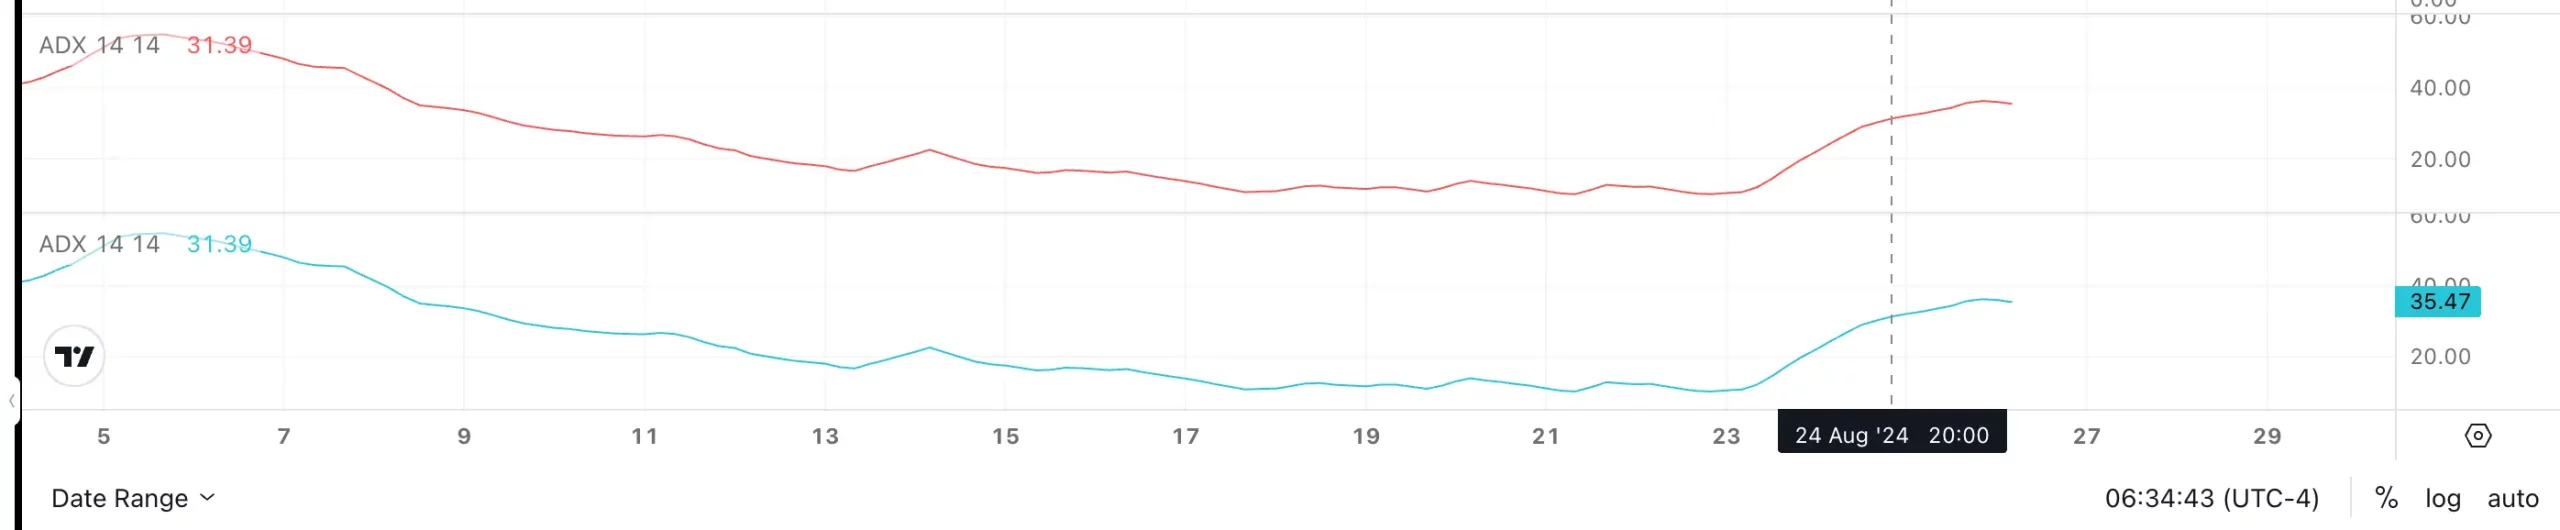
(Source: Bitget website)
9. VOLUME
Overview: Volume is a fundamental indicator that measures the number of assets traded over a certain period. It’s often used to confirm the strength of price movements.
Advantages:
- Confirms price movements, providing a way to gauge the conviction behind a trend.
- Helps identify potential reversals or breakouts, as high volume often precedes significant price movements.
How to Use:
High volume during a price increase suggests strong buying interest and may indicate the continuation of a trend. Conversely, low volume during a price increase may suggest a lack of conviction, potentially signaling a reversal. Traders often look at volume in conjunction with other indicators to confirm trends and predict future price movements.
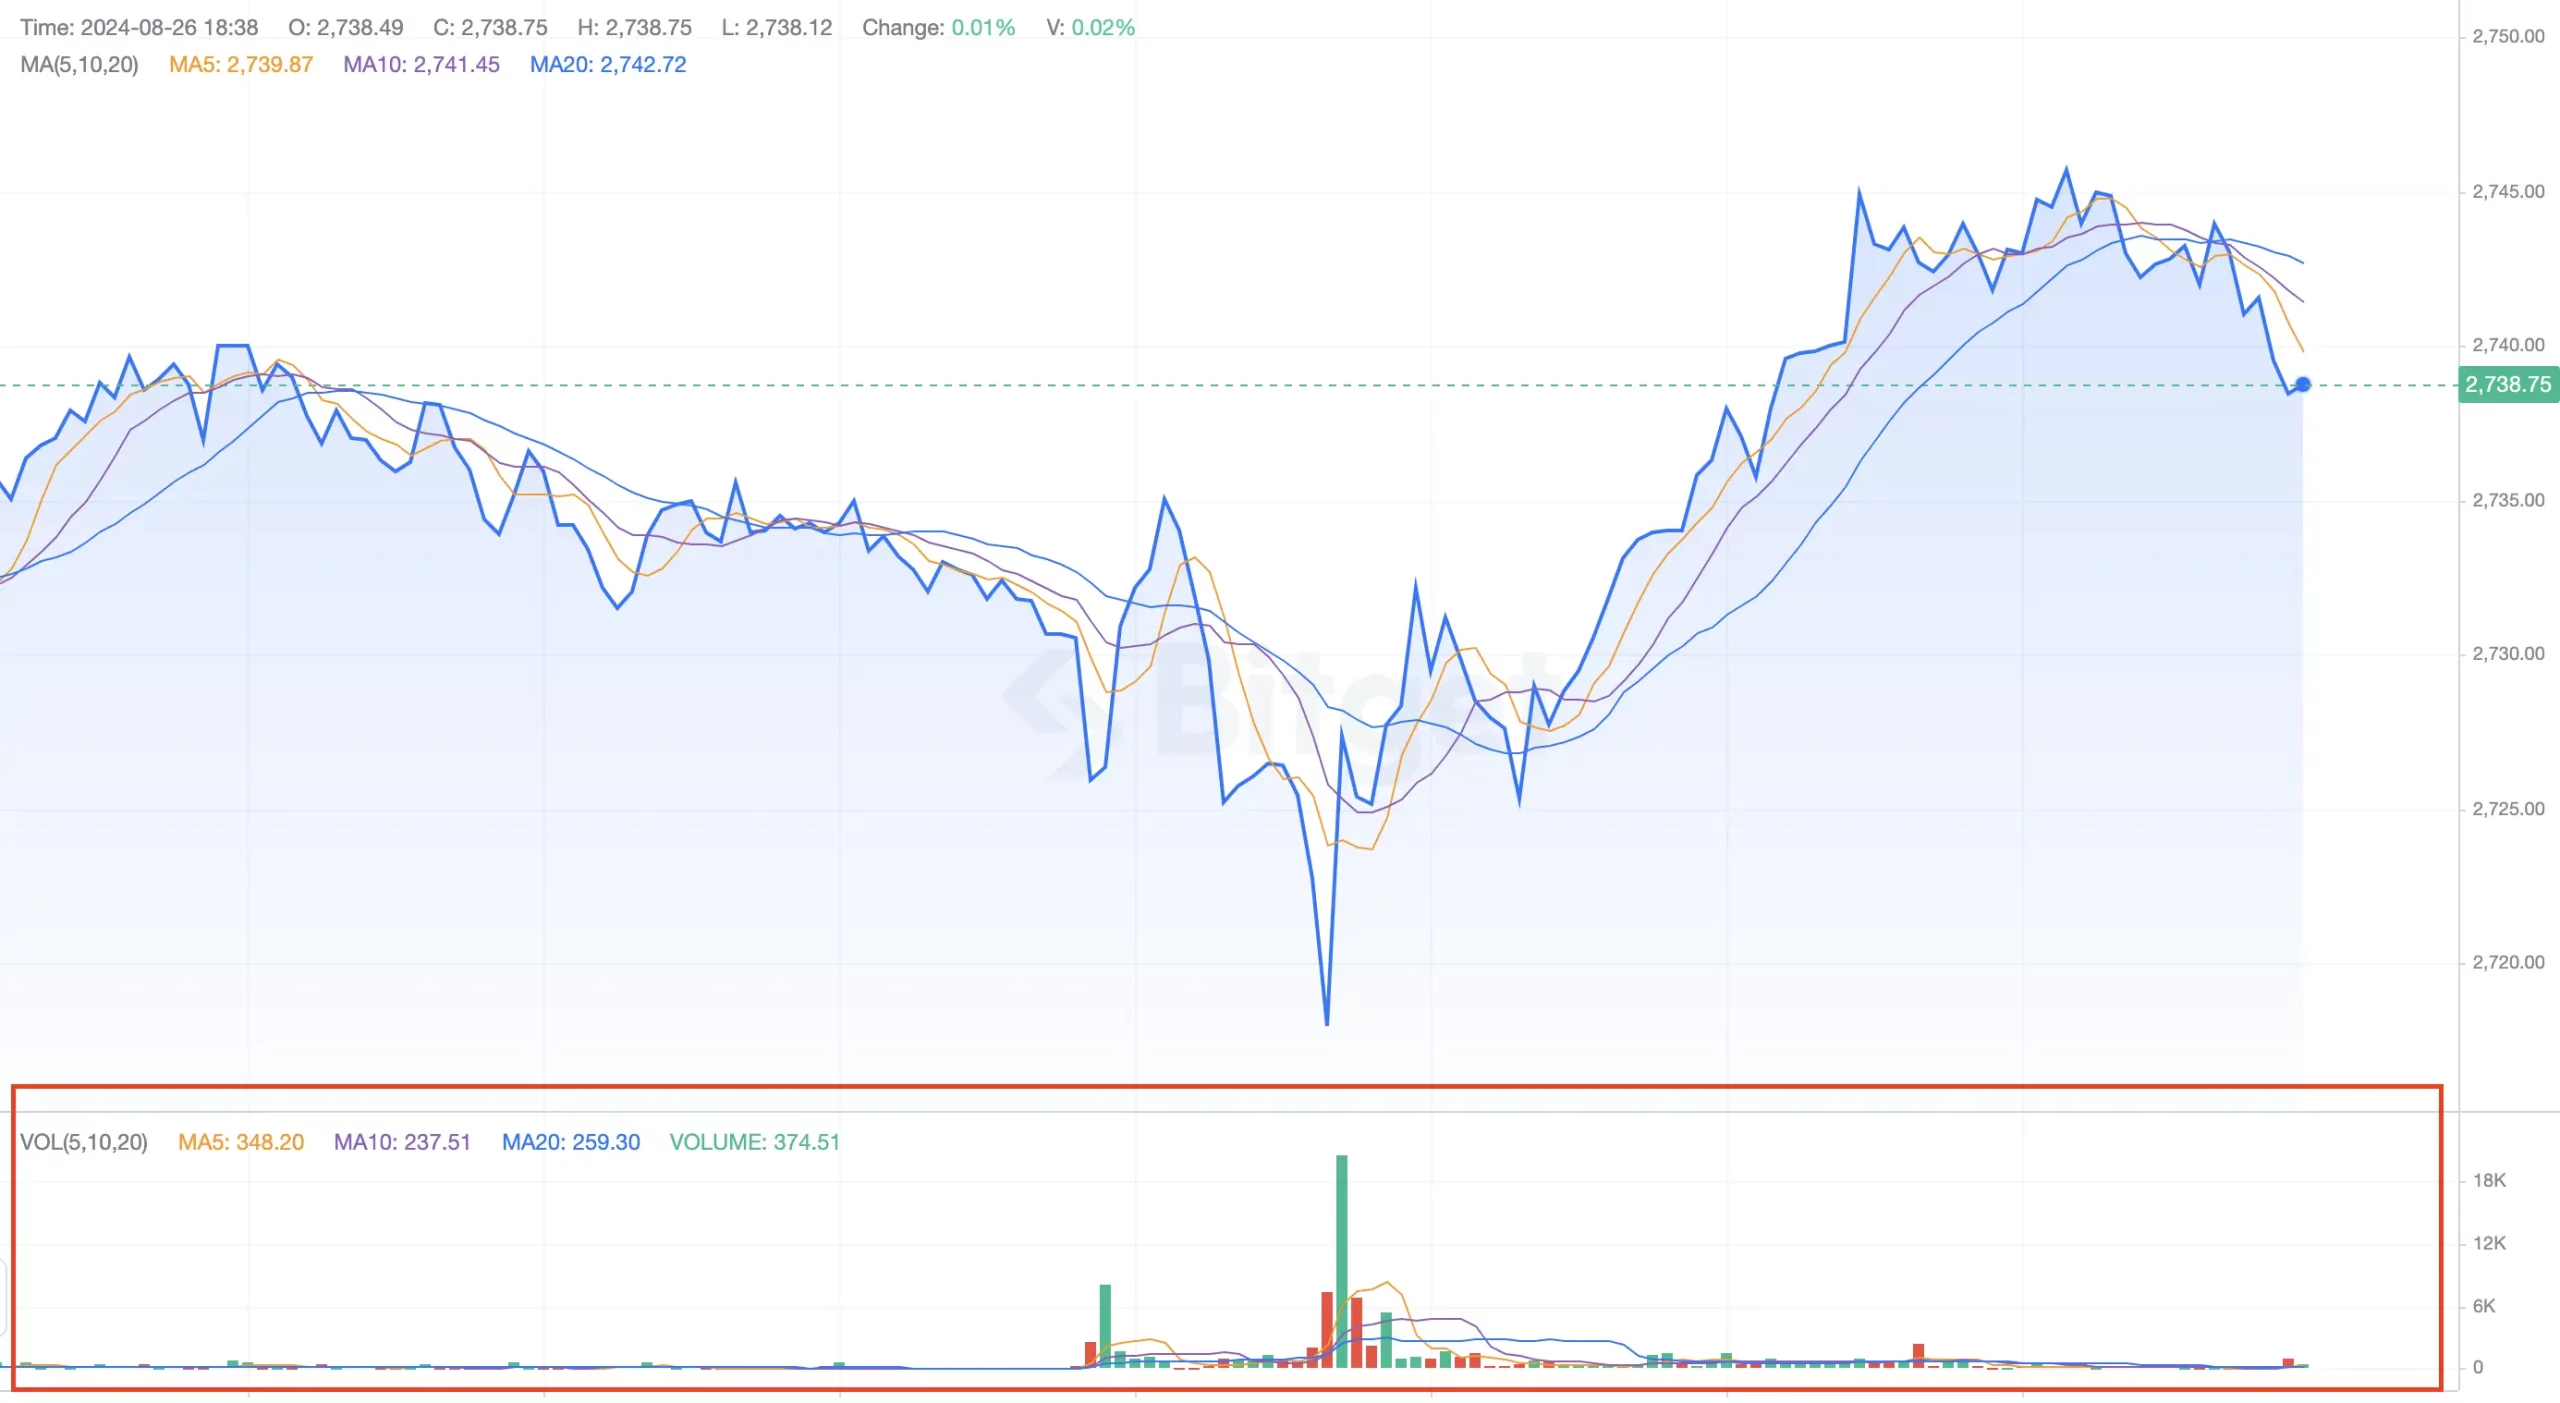
(Source: Bitget website)
10. PARABOLIC SAR (STOP AND REVERSE)
Overview:
The Parabolic SAR is a trend-following indicator that provides potential reversal points by placing dots above or below the price.
Advantages:
- Helps identify potential entry and exit points by signaling trend reversals.
- Useful in setting stop-loss levels, allowing traders to lock in profits as the trend continues.
How to Use:
Traders typically enter a trade when the dots switch from above the price to below (indicating a buy) or from below to above (indicating a sell). The Parabolic SAR is most effective in trending markets and can provide clear exit signals when the trend starts to reverse.
(Source: TradingView)
CONCLUSION
Incorporating technical indicators into your crypto trading strategy is essential for making informed decisions and maximizing potential profits. The 10 indicators discussed in this article—Moving Average, RSI, MACD, Bollinger Bands, Stochastic Oscillator, Fibonacci Retracement, Ichimoku Cloud, ADX, Volume, and Parabolic SAR—each offer unique insights and advantages. Whether you’re a novice trader or an experienced professional, understanding and using these indicators can help you navigate the complexities of the cryptocurrency market in 2024.
>> Also read:
- 4 Trusted Crypto Market Live Trackers for Staying on Trend
- 5 Indicators for Crypto Market Analysis and Where to Find Them
FAQs
- WHAT ARE TECHNICAL INDICATORS?
Technical indicators are mathematical calculations based on the price, volume, or open interest of a security. They are used by traders to analyze past market data, predict future price movements, and make informed trading decisions.
- CAN I RELY SOLELY ON TECHNICAL INDICATORS FOR TRADING DECISIONS?
While technical indicators are powerful tools, it’s important not to rely solely on them. They should be used in conjunction with other forms of analysis, such as fundamental analysis and market sentiment, to get a complete picture of the market.
- WHAT IS THE BEST TECHNICAL INDICATOR FOR CRYPTO TRADING?
There is no single “best” indicator, as different indicators serve different purposes. It often depends on your trading style and the specific market conditions. Many traders use a combination of indicators to confirm their analysis and trading decisions.
- HOW DO I CHOOSE THE RIGHT INDICATORS FOR MY TRADING STRATEGY?
Choosing the right indicators depends on your trading goals, the time frame you’re trading on, and your level of experience. Start with a few simple indicators, like Moving Averages and RSI, and gradually incorporate more complex ones as you gain confidence.
- ARE THESE INDICATORS APPLICABLE TO ALL CRYPTOCURRENCIES?
Yes, these technical indicators are generally applicable to all cryptocurrencies. However, the effectiveness of an indicator may vary depending on the specific cryptocurrency’s market characteristics, such as liquidity and volatility.
- HOW OFTEN SHOULD I REVIEW MY TECHNICAL INDICATORS?
It’s important to regularly review your technical indicators, especially in a fast-moving market like cryptocurrency. Adjust your strategy as needed based on changes in market conditions and your trading performance.