


KEYTAKEAWAYS
- Technical analysis uses past price and volume data to predict future market movements.
- Chart patterns like Double Bottom and Head and Shoulders help identify market reversals.
- Technical indicators such as Moving Averages and RSI provide valuable insights for trading decisions.
CONTENT
Learn how to make 2024 crypto market predictions using technical analysis: chart patterns and indicators to forecast trends.
Have you ever wondered why some people can successfully seize every money-making opportunity? How do they read complex charts? And how do they make crypto market predictions?
In fact, they don’t use any secret techniques, but rather technical analysis, which CoinRank is about to explain to you. By the end of the article, you’ll be able to make 2024 crypto market predictions without the help of others!
>>> Read more:
CRYPTO MARKET PREDICTIONS: WHAT IS TECHNICAL ANALYSIS?
Technical analysis is the study of predicting future market movements by exploring past price and volume data. The core belief of technical analysis is that all market information is reflected in the stock price, and past price patterns can be applied to future stock and crypto market predictions!
In other words, market price movements are not completely random but follow certain patterns. These patterns are reflected in the analysis of trading volume and price, further revealing changes in market sentiment.
CRYPTO MARKET PREDICTIONS: TWO TYPES OF TECHNICAL ANALYSIS
There are two main types of technical analysis, both based on past data to predict future market trends through different methods: Chart Patterns and Technical Indicators.
Type One: Chart Patterns
You can look at chart patterns to make bullish or bearish crypto market predictions by observing and analyzing price trend charts. Candlestick charts, are the most widely used charts that intuitively present price up and down trends.
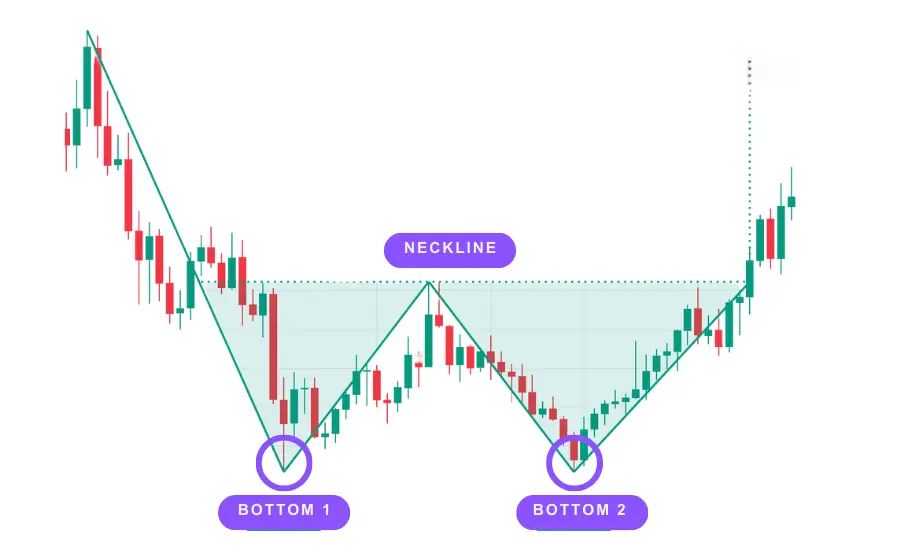
- Double Bottom
Also known as a W bottom, is seen as a strong signal of market reversal, representing a trend shift from bearish to bullish. The basic structure of a W bottom includes two distinct low points with a relatively higher point in between, making it look similar to the letter “W”. These two low points are generally viewed as support levels, representing rebounds after the price falls to a certain level.
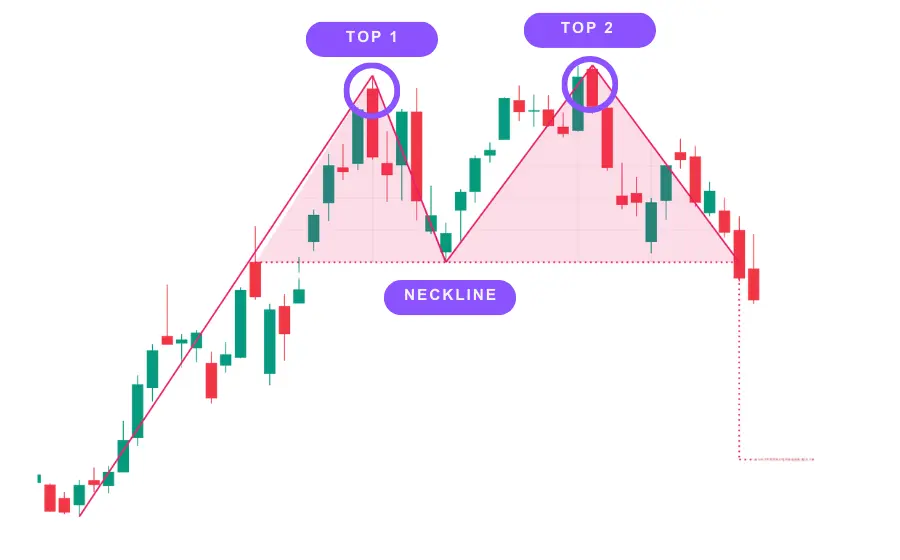
- Double Top
Also known as an M top, is seen as a strong signal of market reversal, representing a trend shift from bullish to bearish. The basic structure of an M top includes two distinct high points with a relatively lower point in between, making it look similar to the letter “M”. These two high points are generally viewed as resistance levels, representing declines after the price rises to a certain level.
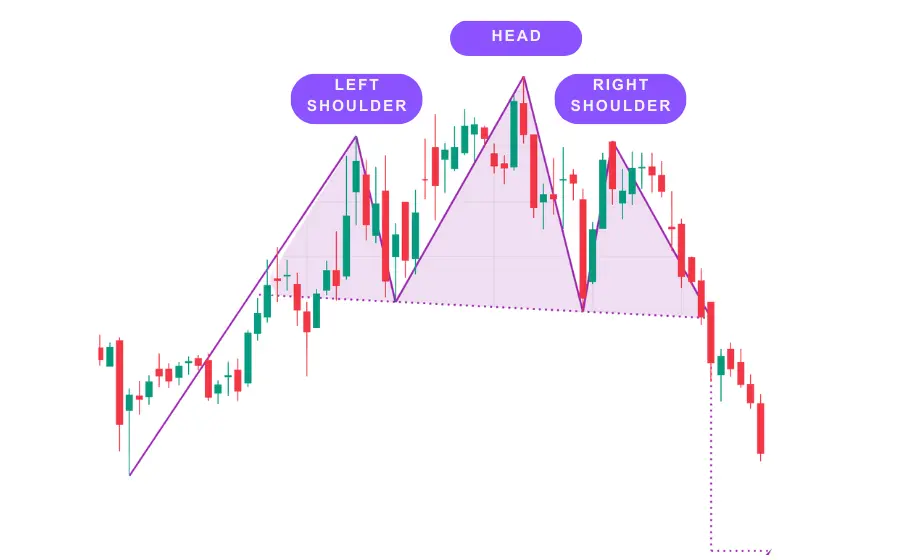
- Head and Shoulders Top
Usually seen as a sign of the end of a bull market and the beginning of a bear market. Its shape includes three main parts: left shoulder, head, and right shoulder, as well as a horizontal line called the “neckline.”
In a head and shoulders top pattern, the “left shoulder” forms when the price rises to a peak and then falls; the “head” forms when the price rises again to a higher peak than the left shoulder and then falls again; the “right shoulder” forms when the price rises again but fails to reach the height of the “head” and then falls again.
Crucially, when the price breaks below the neckline, it’s usually seen as a “sell signal” as it may indicate an impending price trend reversal.
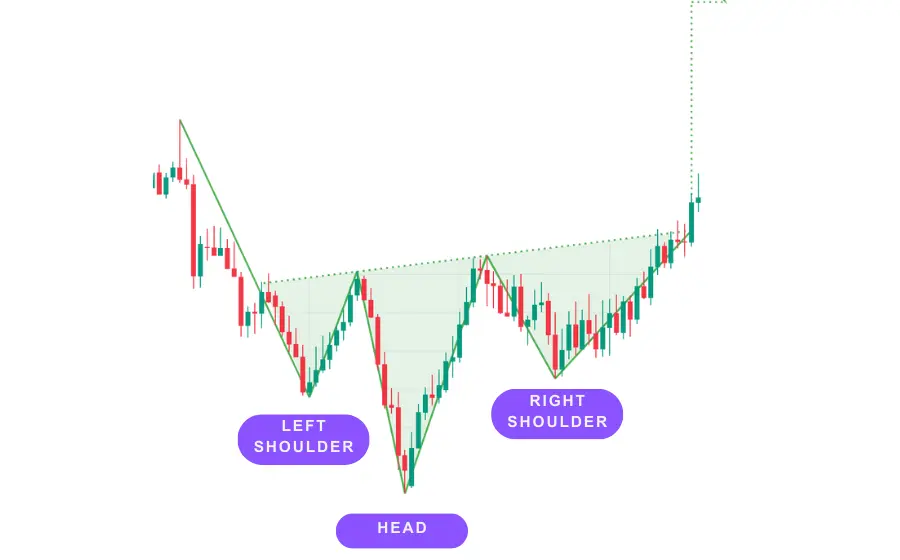
- Head and Shoulders Bottom
Usually seen as a sign of the end of a bear market and the beginning of a bull market.
In a head and shoulders bottom pattern, the “left shoulder” forms when the price falls to a low and then rebounds; the “head” forms when the price falls again to a lower point than the left shoulder and then rebounds again; the “right shoulder” forms when the price falls again but fails to reach the low of the “head” and then rebounds again.
Crucially, when the price breaks above the neckline, this is usually seen as a “buy signal” as it may indicate a reversal of the price trend.
>>> Read more: Learn Crypto Options Trading Basics in 5 MINUTES!
Type Two: Technical Indicators
Technical indicator analysis uses specific calculation formulas to obtain values that are valuable for crypto market predictions. Here are some common technical analysis tools:
- Moving Average (MA)
A tool that displays the average price over a period of time on a chart, helping to observe long-term price trends. It filters out noise in price movements, making it easier to see the main market trend and make crypto market predictions.
However, because it’s based on past price data, it’s considered a lagging indicator. The two most common types of moving averages are: Simple Moving Average (SMA) and Exponential Moving Average (EMA).
SMA is simply the average of prices over a period of time, for example: 10-day SMA is the average price of the past 10 days.
EMA gives higher weight to more recent prices, so it’s more sensitive to reflecting the latest price trends.
For instance, we can make crypto market predictions by comparing market prices with a certain moving average (like 200-day SMA). If the price consistently stays above this moving average, it’s considered that the market is in an upward trend.
Additionally, you can observe the crossover points of moving averages with different periods, such as: when the 100-day SMA falls below the 200-day SMA, it indicates that the recent price trend has changed from upward to downward, which might be a sell signal.
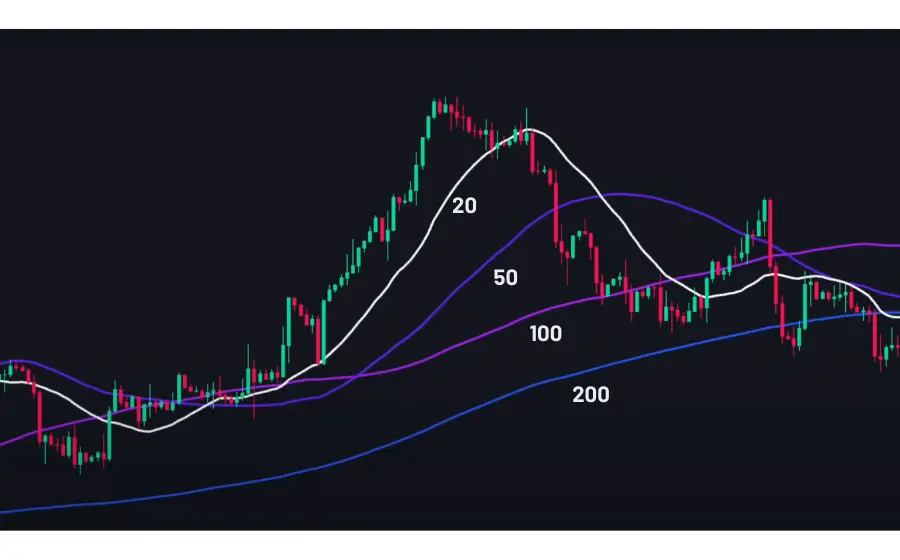
(Source: CoinRank)
- Moving Average Convergence Divergence (MACD)
A tool for observing the difference between short-term and long-term price momentum. It consists of two lines: the MACD line and the signal line.
The crossover and separation of these two lines, as well as their relationship to the price trend, are important information for analyzing market direction. The MACD line is calculated by subtracting the 26-day EMA value from the 12-day EMA value, and then plotting it on the signal line, which is the 9-day EMA of the MACD line.
Many charting tools also include a histogram showing the distance between the MACD line and the signal line.
For example, if the market price is rising but the MACD line is falling (momentum decreasing), the market may be facing an adjustment or reversal.
Also, the crossover point of the MACD line and the signal line can be seen as a trading signal: the MACD line crossing above the signal line might indicate a buy point, while crossing below might signal a sell point.
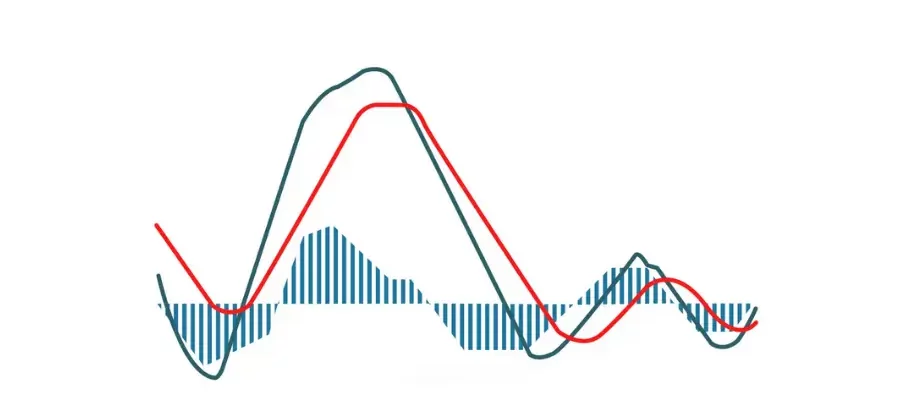
(Source: CoinRank)
>> Also read: What Is MACD? How It Works in Crypto Trading
- Relative Strength Index (RSI)
A tool for measuring the intensity of price movements, used to identify potential price reversal points. It’s also a momentum indicator that can assess whether an asset is overbought or oversold.
It’s calculated by analyzing the rate of price changes over a period of time (usually 14 periods) and is presented as a value between 0 and 100.
When RSI exceeds 70, the asset is considered overbought, with a risk of price decline; when RSI is below 30, the asset is considered oversold, with a chance of price rebound.
It’s important to note that RSI shouldn’t be used alone for buy or sell decisions, as it may provide inaccurate or misleading signals. When trading, it’s best to combine it with other analysis tools or market information.
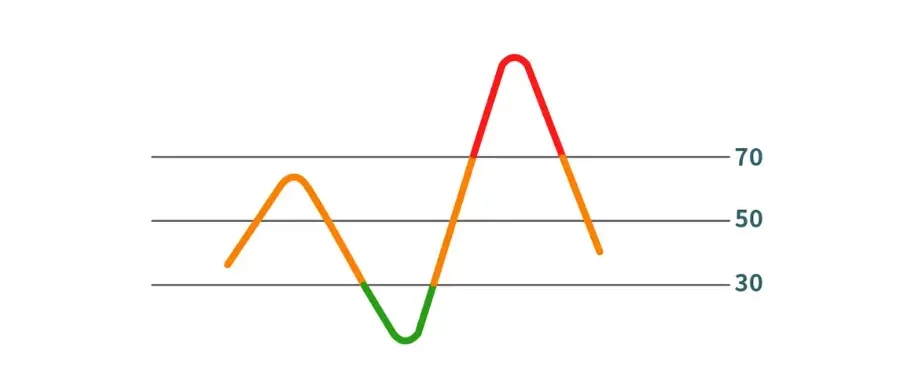
(Source: CoinRank)
>> Also read: What Is RSI, and How Do You Use It in the Crypto Market?
- Stochastic Oscillator
Also known as KD, is used to judge market overbought or oversold conditions to predict potential price reversal points. The Stochastic Oscillator includes two lines: the K line and the D line.
The K line represents the relative position of the current price within the recent period, calculated as (Current Closing Price – Recent Lowest Price) / (Recent Highest Price – Recent Lowest Price) * 100.
The D line is the moving average of the K line, usually taking the average of the K values from the most recent 3 or 5 days.
In charts, the K line is usually represented by a solid line, and the D line by a dotted line. When the K line crosses the D line from below, it’s seen as a buy signal; conversely, when the K line crosses the D line from above, it’s seen as a sell signal.
Additionally, the KD indicator’s value range is usually set between 0 and 100, with values above 80 considered overbought and below 20 considered oversold. When the KD indicator enters these two areas, it may indicate an imminent market reversal.
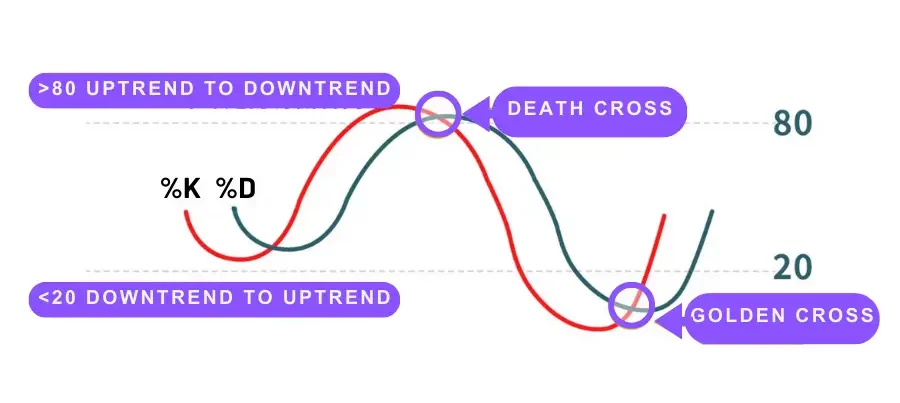
(Source: CoinRank)
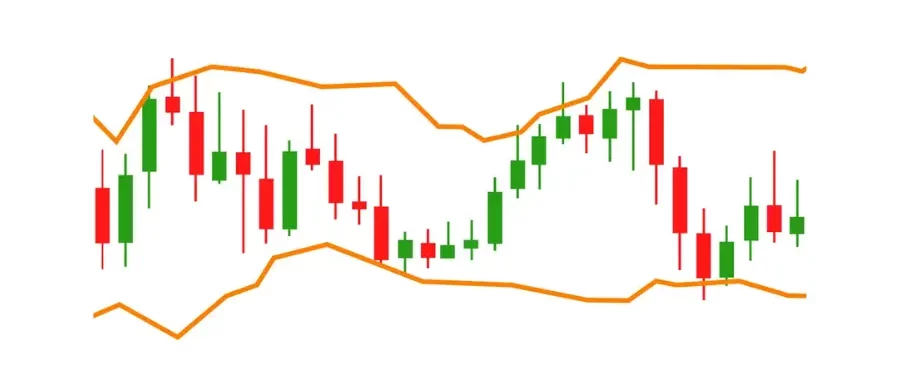
- Bollinger Bands (BB)
A price channel surrounding the moving average of the price, used to observe the degree of price volatility and potential price reversal points. It consists of three lines: upper band, middle band, and lower band.
Typically, the upper and lower bands are within two standard deviations of the middle band, and the distance between these two bands and the middle band adjusts with changes in market volatility.
When the price approaches the upper band, it indicates the asset is overbought, while price near the lower band represents the asset is oversold. In most cases, the price fluctuates within the range defined by these three lines, but sometimes it may break through the upper or lower limits.
Although this crypto market prediction doesn’t directly represent a trading signal, it suggests that the market may be in an extreme state.
Additionally, “squeeze” is another important concept in Bollinger Bands. When the three bands come close to each other, it may indicate that a period of high volatility in the market is about to come; conversely, if the three lines are too far apart, it may suggest that a period of low volatility is approaching.
>>> Read more: Best Crypto Trading App: Top 3 Safest and Reliable
CONCLUSION
Using technical analysis to identify crypto market predictions can be tricky at first, but it gets easier as you practice. There are many tools to help you analyze markets, but using more tools doesn’t always make things clearer. Sometimes, looking at simple charts can help you understand market trends faster and better. As you keep doing this, you’ll figure out which tools work best for you and the markets you’re watching.
>>> Read more:
FAQS
- How can technical analysis help with crypto market predictions?
It uses past price and volume data to forecast future market movements and trends.
- What are two main approaches to crypto market prediction using technical analysis?
Chart patterns and technical indicators.
- Are more tools always better for crypto market prediction?
Not necessarily. Sometimes simpler charts provide clearer insights for market predictions.
More articles about the crypto market:
- Crypto Bull Market 2024: What It is and When to Buy
- 4 Recommended Crypto Market Live Trackers for Staying on Trend
- Crypto by Market Cap Ranking 2024 – Top 10 Cryptos You Should Know – CoinRank
- 2024 Top 5 Crypto Market News Websites
- A Review of Crypto Market Trends in the First Half of 2024
▶ Buy Crypto at Bitget
CoinRank x Bitget – Sign up & Trade to get $20!