


KEYTAKEAWAYS
- Bitcoin Power Law models Bitcoin’s price movements using a logarithmic scale, revealing long-term trends and potential investment opportunities.
- Traders can use the power-law chart to identify key support and resistance levels for better decision-making.
- Combining power-law analysis with other technical indicators improves accuracy in predicting Bitcoin’s price movements and market cycles.
CONTENT
Bitcoin Power Law is a unique theory that analyzes Bitcoin’s historical prices on a logarithmic scale to help traders predict future price movements and identify potential investment opportunities. In the fast-changing cryptocurrency market, traders rely on technical tools and strategies to forecast trends, especially given Bitcoin’s price volatility.
WHAT IS THE BITCOIN POWER LAW?
The Bitcoin Power Law is a mathematical model that suggests Bitcoin’s price follows a predictable power-law distribution pattern. This theory transforms historical price data into logarithmic coordinates, combined with a time axis, to forecast future price trends. According to the power-law model, Bitcoin’s price fluctuations exhibit exponential growth or decline trends.
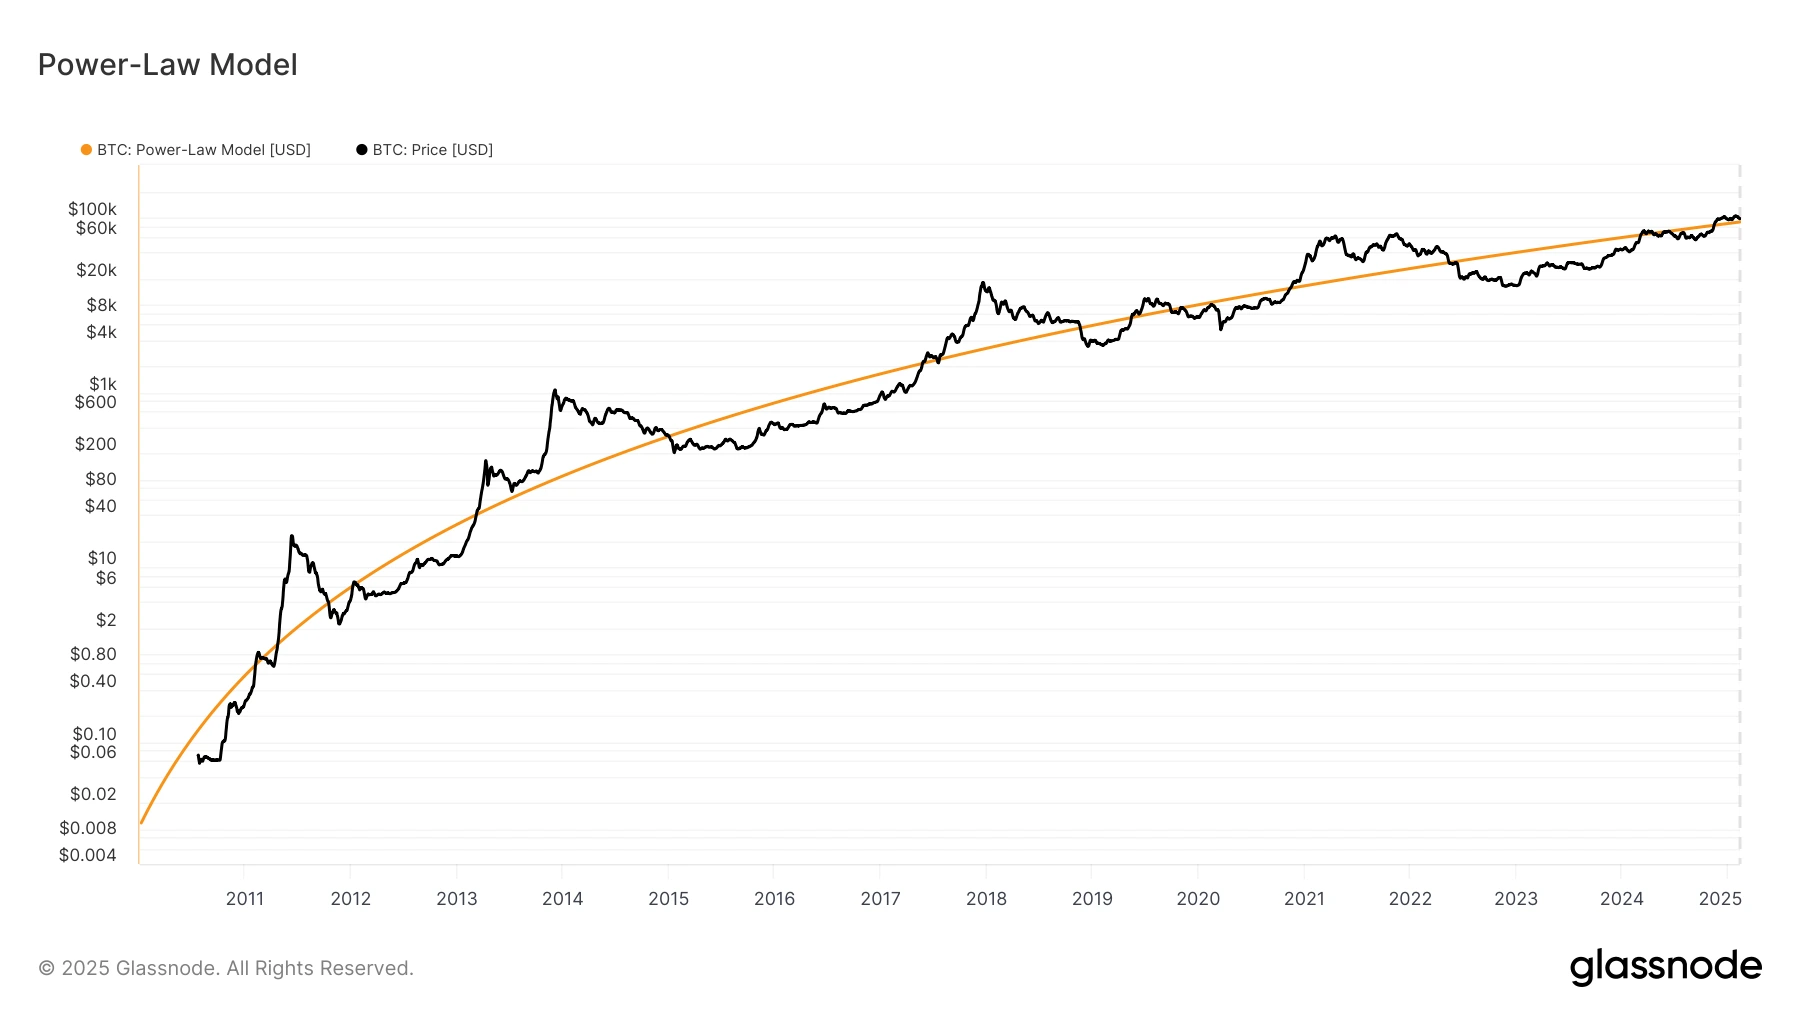
(Source:glassnode)
Specifically, the model displays Bitcoin’s price changes on a logarithmic scale, making long-term trends more apparent. Sharp price increases or decreases appear smoother on this scale, revealing hidden patterns behind Bitcoin’s volatility.
HOW TO CONSTRUCT A BITCOIN POWER LAW CHART
To create a Bitcoin Power Law chart, follow these steps:
1. Logarithmic Scale Transformation:
Convert the X-axis (time) and Y-axis (price) to a logarithmic scale. This step highlights the exponential growth of Bitcoin prices, making long-term trends more visible.
2. Plot Historical Prices:
Map Bitcoin’s historical price data on the chart and apply linear regression to determine the long-term price trend. This trend line forms the foundation of the power-law model.
3. Identify Support and Resistance Levels:
By analyzing the price movement around the regression line, traders can define support zones (where price tends to rebound) and resistance zones (where price often pulls back), helping predict possible breakouts.
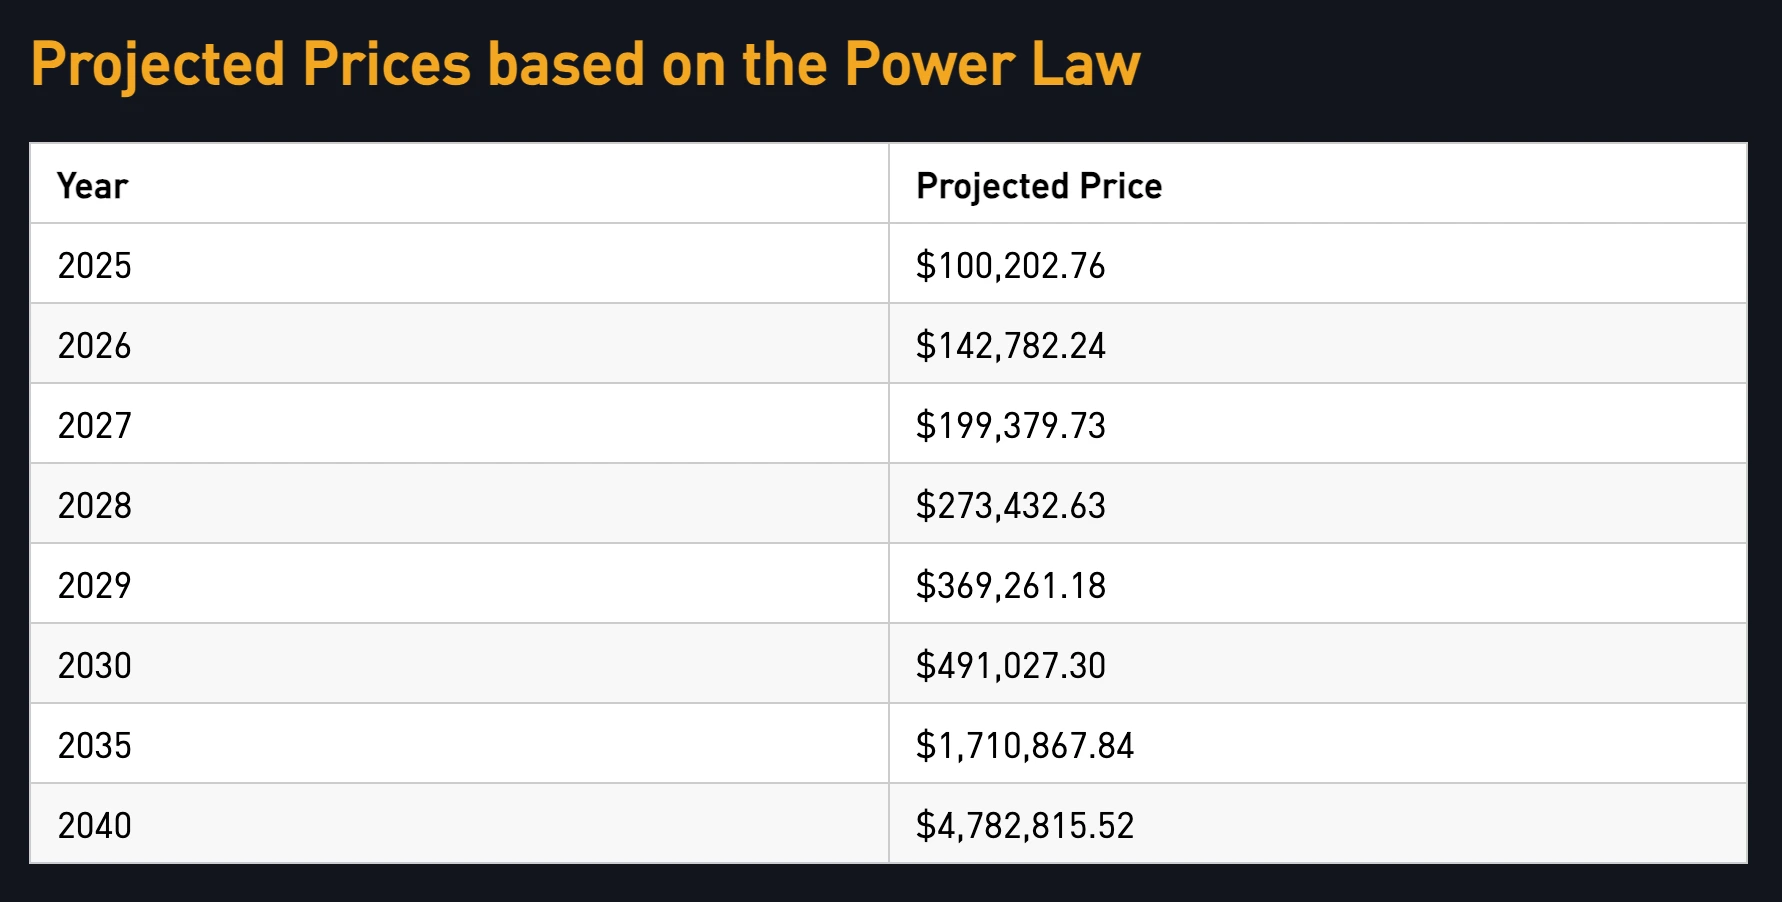
4. Forecast Future Trends:
Using the time axis, the power-law model projects potential future price movements. If the price nears the upper boundary of the trend, it may signal an overheated market and a potential correction. Conversely, if it nears the lower boundary, it could indicate a buying opportunity.
These charts help traders analyze Bitcoin’s price swings, identify overbought or oversold areas, and make informed entry and exit decisions.
APPLICATIONS OF THE BITCOIN POWER LAW
• Trend Prediction:
Traders use the regression line and past price movements to estimate Bitcoin’s potential price range and adjust their buying or selling strategies accordingly.
• Market Cycle Analysis:
Bitcoin’s price movements often follow specific cycles. The power-law model helps traders recognize these cycles, such as bull and bear markets, to plan strategic trades.
• Volatility Assessment:
By examining past price fluctuations, traders can gauge periods of stability and volatility, helping them anticipate potential market calm or turbulence.
• Investment Decision-Making:
Identifying price patterns allows traders to establish long-term investment strategies. Buying near support levels and selling at resistance levels can optimize returns.
Also Read:
What Is MACD? How It Works in Crypto Trading
HOW TO USE THE POWER LAW MODEL TO PREDICT BITCOIN PRICES
Using power-law analysis, traders can evaluate Bitcoin’s position relative to support and resistance levels:
• Approaching the Upper Limit:
If the price nears the trend’s upper boundary, it may indicate an overbought market, signaling a potential pullback. Traders might consider selling or waiting for a better buying opportunity.
• Approaching the Lower Limit:
If the price is near the lower boundary, it may suggest an oversold market, potentially leading to a rebound. This could be a buying opportunity.
• Middle Range Movements:
When the price is within the mid-range of the trend, it suggests the market is in a support or resistance zone. Traders can evaluate additional technical indicators to confirm their next move.
Additionally, the power-law model helps traders recognize key market turning points, such as trend reversals or accelerations. By combining it with other tools like moving averages and relative strength index (RSI), traders can improve their accuracy in forecasting Bitcoin’s price movements.
CONCLUSION
The Bitcoin Power Law is a mathematical model that provides insights into Bitcoin’s long-term price behavior by analyzing historical data. It helps traders identify trends, support and resistance levels, and potential investment opportunities.
However, the cryptocurrency market is highly volatile, influenced by technological changes, regulations, and market sentiment. As a result, the power-law model should be used with caution and in combination with other analysis methods, such as fundamental and technical analysis.
By understanding the Bitcoin Power Law, traders can better navigate market fluctuations, recognize trading opportunities, and maintain a rational approach in the fast-moving cryptocurrency industry.
Also Read:
Solana Network Operates Stably for One Year Without Downtime, Setting Historical Record