


KEYTAKEAWAYS
- The Crypto Fear & Greed Index measures market sentiment, helping investors gauge extreme fear or greed to make more informed decisions.
- Funding rates in perpetual contracts indicate market direction and sentiment, with positive rates signaling bullish trends and negative rates bearish.
- Stablecoin flows, open interest, and exchange flows provide crucial data on market liquidity, capital inflow, and potential price movements in cryptocurrencies.
CONTENT
Find out five essential indicators for crypto market analysis with CoinRank: Fear & Greed Index, Funding Rates, Stablecoin Flows, Open Interest, and Exchange Flows. Gain insights to make informed investment decisions.
WHY DO WE NEED INDICATORS FOR CRYPTO MARKET ANALYSIS?
Just as investors new to the stock market base their investment allocations and seek optimal returns on various data and technical analyses, such as demand and supply, margin trading volumes, director and supervisor shareholdings, and insider trading, or analyzing candlestick charts, technical indicators (MACD, RSI, etc.), technical patterns, and volume-price relationships, these are all references used by investors.
What about the crypto market? Although the crypto market has not developed for as long or matured as much as the stock market or other traditional financial product markets, there are actually several indicators that can be used for crypto market analysis.
In this article, we will introduce five indicators for analyzing the crypto market for readers’ reference and also provide crypto market analysis charts below, allowing you to become more proficient in grasping the crypto market based on data and numbers.
5 IMPORTANT INDICATORS FOR CRYPTO MARKET ANALYSIS
1. CRYPTO FEAR & GREED INDEX
The Crypto Fear & Greed Index is established based on factors such as cryptocurrency prices, social media, Bitcoin dominance, and Google search volume. It is used to observe market investment sentiment and as an indicator for trend reversal observation. The Fear & Greed Index ranges from 0 to 100, with higher values representing more greed in the market, and lower values representing more fear. When the Fear & Greed Index is below 20, it indicates that the market is in a state of extreme panic, and investors should act cautiously; when the index is above 80, the market is in a state of extreme greed, and investors should be even more cautious.
The Fear & Greed Index tracks current market sentiment from the following indicators:
- Volatility: Measures the current volatility and maximum drawdown (MDD) of BTC relative to its average values over the last 30 days and 90 days.
- Market momentum / volume: Measures the current volume and market momentum relative to the average values of the last 30 days and 90 days (evaluating market overreaction).
- Social media: Uses the number of Bitcoin hashtag (#Bitcoin) posts and their interaction rates.
- Bitcoin dominance: The recovery of Bitcoin dominance may be caused by fear or selling of other alt-coins due to high risk in the market.
- Google Trends: Search volume for positive or negative news about Bitcoin.

You can find the data via Binance.
2. FUNDING RATES
In previous futures trading tutorials, we introduced the existence of perpetual contracts in the crypto market, which are futures contracts without settlement dates. However, if there’s no settlement date, it will inevitably cause the spot and futures prices to decouple (for example, when most people are bullish on Bitcoin and go long on BTC contracts, it will push up the Bitcoin futures price, thus causing the Bitcoin futures price to be higher than the spot price. If there’s no settlement date, it might lead to more and more people taking long positions, resulting in an increasing gap between BTC spot and futures prices). To avoid this situation, the funding rate mechanism was introduced.
You can view the “funding rate” as a payment to arbitrageurs to ensure that the perpetual contract price is close to the spot price (actually paying the difference between the two prices).
Taking the above BTC example, when the long force is stronger, indicating that the Bitcoin perpetual contract is higher than the Bitcoin price, the funding rate will be positive. Long investors need to pay funding to the short side according to the funding rate to maintain their long positions. The more the Bitcoin perpetual contract exceeds the Bitcoin price and the stronger the long side is, the higher the funding rate will be, and the long side will need to pay more to the short side. Similarly, when the short side is strong and the Bitcoin perpetual contract is lower than the Bitcoin price, the funding rate will be negative, and short investors need to pay funding to the long side according to the funding rate to maintain their short positions.
The funding rate is displayed as a percentage and is a periodic fee paid to long or short traders based on the price difference between the perpetual contract market price and the spot price. The settlement period varies depending on different exchanges.
The funding rate usually consists of two parts: interest rate and premium. The interest rate is generally fixed at 0.01% for each funding interval (usually settled every 8 hours), while the premium depends on the difference between the perpetual price and the spot price.
Since the interest rate is fixed at 0.01% per interval, 0.01% is often regarded as the “market neutral” funding rate. From this perspective, the funding rate can be used as a standard to measure the degree of overheating or overselling of an asset.
What is the relationship between funding rates and market sentiment? Funding rates are usually consistent with the overall rise and fall of the related underlying asset, meaning that if the price of the related underlying asset rises, the funding rate tends to be positive and continues to rise.

You can find the data via coinglass.
3. STABLECOIN FLOWS
The supply or circulation of stablecoins is also one of the important indicators providing data for crypto market analysis.
Simply put, if there’s a sell-off in the market and investors expect the value of cryptocurrencies to decline, they might exchange their currently held cryptocurrencies for stablecoins to hedge. Converting other coins back to stablecoins also allows investors to quickly and easily reallocate their assets back to the crypto market.
On the other hand, a rapidly increasing stablecoin supply (measured by market cap) relative to the total cryptocurrency market cap might be a bottom signal after a market decline, as it could represent assets that can quickly flow back into the overall market.
Therefore, investors also refer to the flow direction of stablecoins to adjust their direction before deciding on investment strategies.

You can find the data via The Block.
4. OPEN INTEREST (OI)
Open interest refers to the total number of outstanding futures or options contracts in the market.
What readers often hear about open interest or ‘positions’ actually refers to the same concept. For example, Bitcoin open interest and Bitcoin positions refer to the same thing.
Open interest is an indicator that measures the amount of money invested in crypto derivatives (such as futures contracts) at any given time. When traders enter crypto futures or options contracts, the open interest increases. When contracts are closed or expire, the open interest decreases. Therefore, open interest can be viewed as the number of unsettled contracts in the market.
So why is “open interest” an important indicator? Because it’s an overall indicator of capital flowing into the market. As more capital flows into the market, the open interest increases, and vice versa. Therefore, open interest is considered an important indicator for crypto market analysis.
Since open interest includes both long and short open positions, high values of open interest usually represent increased price volatility. Therefore, when combined with price trends, open interest can be used to determine the arrival of market tops and bottoms.
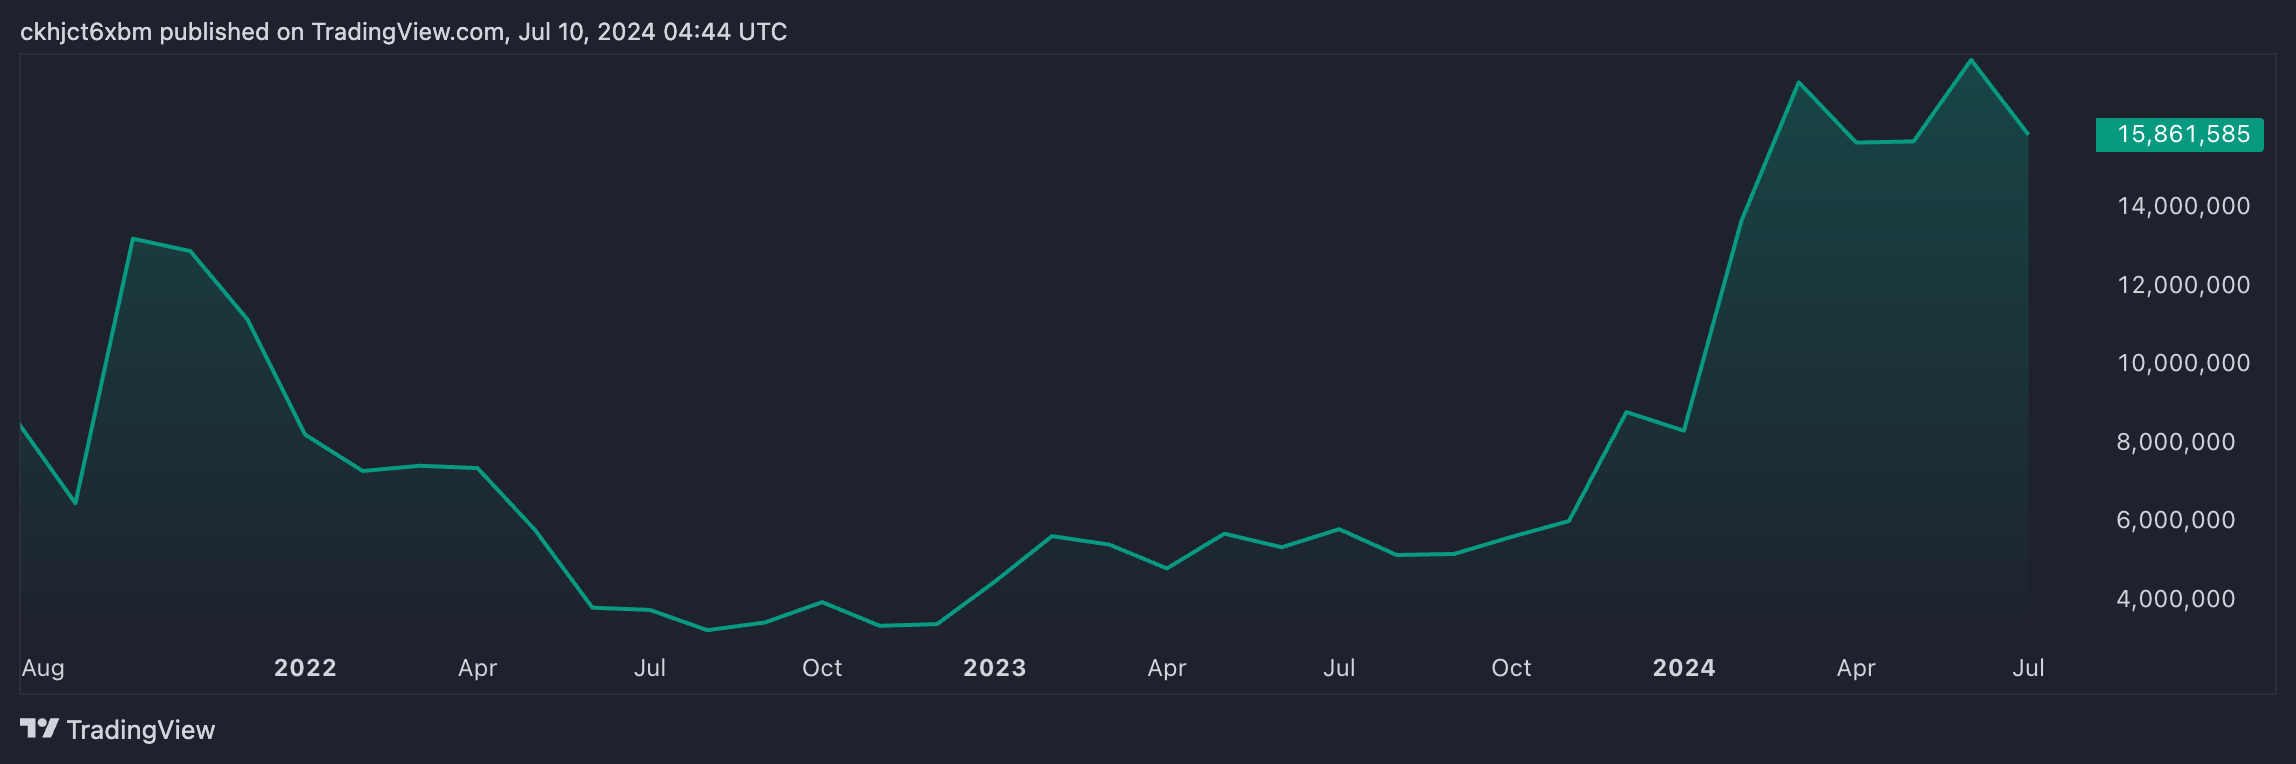
(BTCUSD Open Interest)
You can find the data via TradingView.
5. EXCHANGE FLOWS
The last indicator for crypto market analysis to be introduced is the inflow or outflow of funds from major exchanges.
If the market is generally bearish and worried about the value of held coins decreasing, some holders might sell cryptocurrencies on exchanges.
Net exchange flows are an indicator of this trend: it measures the net number of tokens entering and exiting exchanges. If there’s a sudden increase in the net inflow of a particular coin to exchanges, it might mean that coin holders are “unloading” and selling that coin on exchanges, and vice versa.

You can find the data via CryptoQuant.
SUMMARY
In this article, we introduced five indicators for crypto market analysis: funding rates, the Crypto Fear & Greed Index, stablecoin flows, cryptocurrency open interest, and exchange flows. Basically, these indices are based on data changes to understand the current market attitude and views on trading. These crypto market analysis indicators also provide investors with good analytical reference directions, avoiding unnecessary losses from investing without preparation.
FAQS
- Why do We Need Indicators for Crypto Market Analysis?
Indicators for crypto market analysis allow you to become more proficient in grasping the crypto market based on data and numbers.
- What indicators for crypto market analysis we can refer to?
Investors can refer to:
- Crypto Fear & Greed Index
- Funding Rates
- Stablecoin Flows
- Open Interest (OI)
- Exchange Flows
when they need figures for crypto market analysis.
More articles about the crypto market:
- Crypto Bull Market 2024: What It is and When to Buy
- 2024 Crypto Market Predictions Backed by Technical Analysis
- Crypto by Market Cap Ranking 2024 – Top 10 Cryptos You Should Know – CoinRank
- 2024 Top 5 Crypto Market News Websites
- A Review of Crypto Market Trends in the First Half of 2024
▶ Buy Crypto at Bitget
CoinRank x Bitget – Sign up & Trade to get $20!