KEYTAKEAWAYS
- The recent crypto crash followed a three-step whale manipulation pattern: false breakout, altcoin bloodbath, and strategic rebounds, creating opportunities for sophisticated traders.
- Bull market crashes occur when new capital inflow can't match price growth, often triggered by overleveraged positions and psychological price barriers.
- Predict market crashes by monitoring key indicators like RHODL ratio, MVRV, and market sentiment, while focusing on coins showing resilience during downturns.

CONTENT
Deep dive into December’s massive crypto market crash that triggered 570,000 liquidations. Learn whale manipulation strategies, bull market crash patterns, and key indicators to predict future market downturns.
*Ready to explore these opportunities? Trade on Bitget now. Remember: This content is informational only – always trade responsibly.
In the early hours of December 10th, Bitcoin led a sharp market decline in the crypto market, resulting in over 570,000 liquidations overnight, with $1.72 billion worth of positions liquidated within 24 hours. This created the second-highest number of liquidations in history, causing many people to exit the crypto market.
The crypto market is known for its high volatility and uncertainty. Looking at historical data, such dramatic crashes are not uncommon.
As mentioned in a previous article, “Why Won’t Bitcoin Continue to Rise Steadily After a Rate Cut?“, during the first three halving bull markets, Bitcoin experienced numerous major drops:
in the first halving bull market, there were 25 instances of daily drops exceeding 15%; in the second halving bull market, there were 17 such instances; and in the third halving bull market, there were 8 instances of drops exceeding 15%, with drops exceeding 10% occurring twice as frequently.
Experienced crypto market investors know that each halving bull market includes major drops following significant rises.
Although prices often reach new highs after these drops, sharp market declines can be painful for many investors, sometimes leading to tragic situations where “after a drop and rise, the price remains the same, but the coins are gone.”
So why do bull markets experience frequent crashes? How can we predict these crashes and prepare for them? This article will delve into these questions and highlight some common market indicators to help you better anticipate market crashes.
ANATOMY OF THE WHALE MANIPULATION
This bull market is driven by multiple factors including Bitcoin halving, Federal Reserve rate cuts and monetary easing, and Bitcoin spot ETF approval.
Its duration and intensity surpass the previous three halving cycles.
Correspondingly, the crash intensity is stronger, and whale manipulation tactics are more deceptive, as higher market consensus means simple manipulation techniques are less effective, requiring more complex combinations to achieve their goals.
From this recent crash, we can see the whales executed a three-step manipulation strategy:
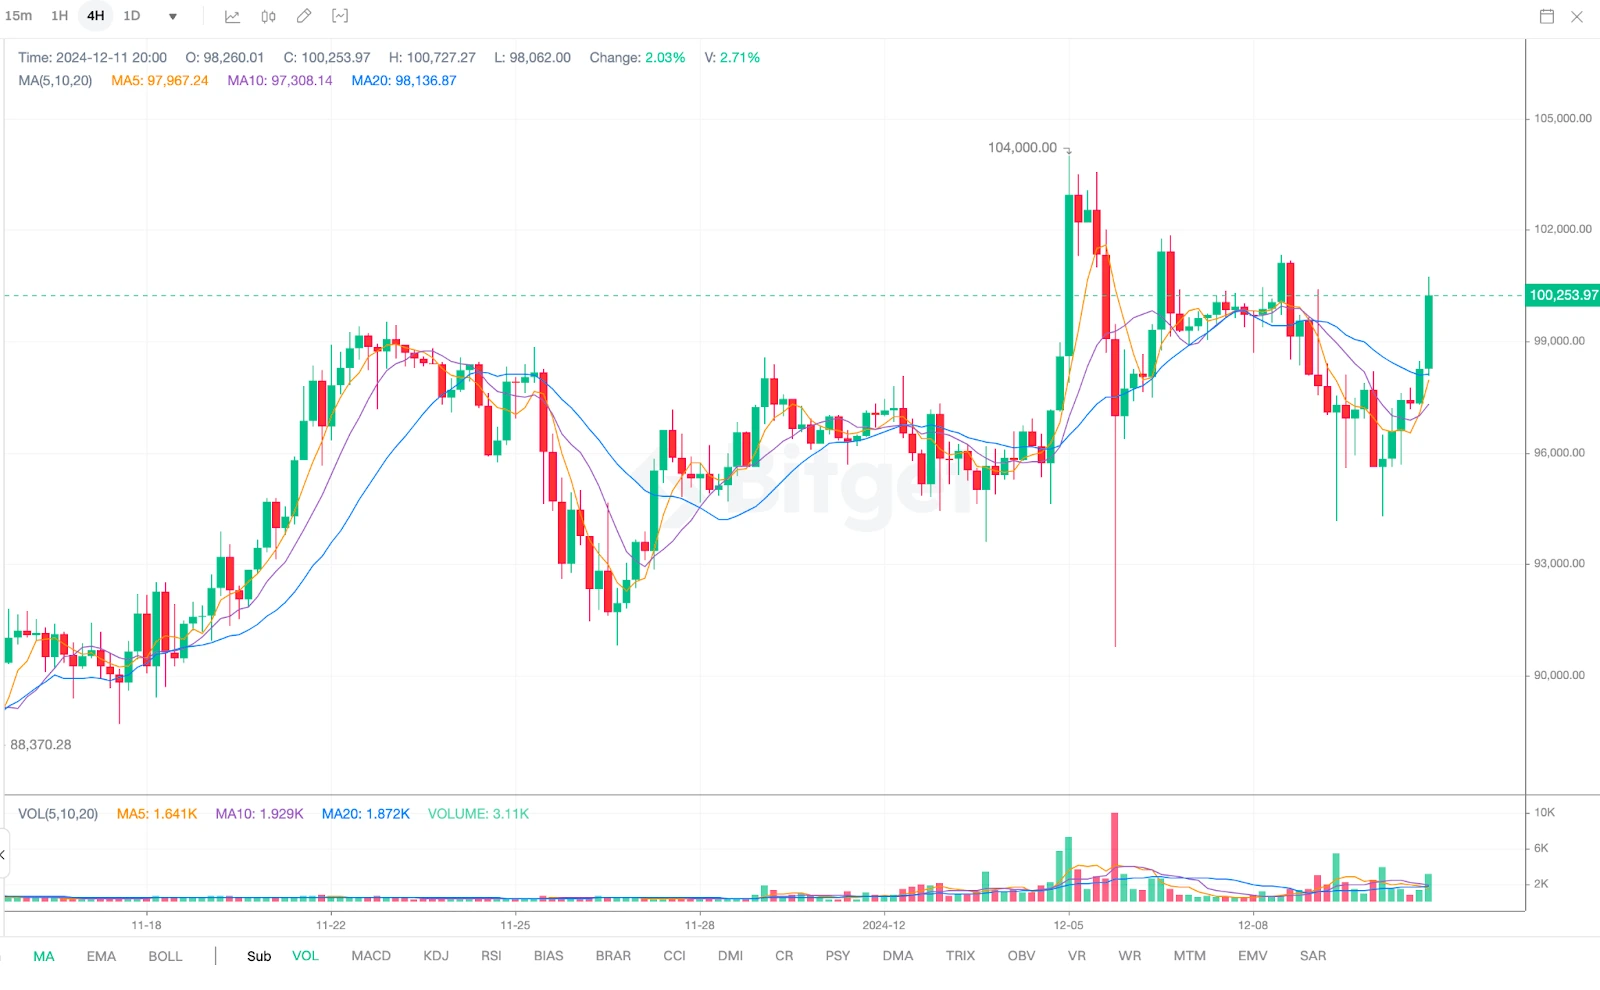
Step One: Bitcoin made a false breakthrough of the market’s psychological expectation – breaking $100,000 to bait traders, raising bullish expectations, then quickly plunging from $104,000 to $90,790 (Bitget data), dropping 13,210 points or 13%.
This Bitcoin crash was aimed at clearing various leveraged positions, causing $1.098 billion in liquidations across the market, with $816 million in long positions liquidated.
During Bitcoin’s sharp decline, altcoins didn’t fall as much, creating an illusion that Bitcoin’s drop was just about leverage liquidation while altcoins would continue rising.
Bitcoin Long Wick Pattern
(Source: Bitget)
Step Two: In the early hours of the 10th, Bitcoin began a sustained decline, though not dropping much itself. However, altcoins experienced a bloodbath.
Whether traditional mainstream coins like ETH, XRP, ADA, SOL, or popular new tokens like ORDI, OP, WLD, all saw sharp drops within 30 minutes, falling 15% to 20%, with overall drops exceeding 30% or even halving in value.
This move was the most devastating, causing 570,000 people to lose their investments.
Step Three: After the crash, there was a sharp rebound to attract retail buyers to “buy the dip,” but the market moved sluggishly.
Until the early hours of the 11th, a second drop occurred, almost touching new lows, shaking out many dip buyers and causing potential buyers to become cautious.
This setup allows for quick price increases later to attract FOMO buying from retail investors.
This explains the entire crash manipulation process, though whether there will be more moves remains uncertain. From the perspective of the fourth halving bull market, there will likely be many more such crashes and manipulations ahead.
As many experienced investors have heard: “Bull markets have many crashes, bear markets have many sharp rises.” Specifically for Bitcoin’s halving bull markets, “crashes” are inherent to the bull market cycle.
Why are bull markets prone to crashes?
There are many answers to this question, but the most fundamental one is: The rate of new capital flowing into the market can’t keep up with the market’s rising speed.
At this point, bullish momentum becomes difficult to maintain, and with many profitable positions in the market, profit-taking sentiment grows, gradually reversing market direction and triggering panic selling, leading to crashes.
Quick corrections typically occur when prices reach key psychological levels, such as previous highs or round numbers, just like this crash that came after Bitcoin approached $100,000.
Another reason is liquidations in the leveraged market.
During bull markets, investors tend to use high leverage to pursue higher returns. However, sudden market price movements can trigger mass forced liquidations, intensifying price drops.
This leads to crashes often accompanied by large liquidation data, with this crash resulting in nearly $3 billion in liquidations.
In bull markets, market sentiment can easily shift from extreme optimism to panic. Once negative news appears (such as regulatory policies or black swan events), retail investor confidence can quickly collapse, leading to stampede-like selling.
These factors are exploited by major players for market manipulation, who create price drops by selling large amounts of Bitcoin to trigger market panic, forcing retail investors to sell their Bitcoin, before accumulating at lower prices to prepare for the next upward move.
Overall, Bitcoin crashes during halving bull markets are normal market cycle behavior, usually representing short-term adjustments that provide momentum for subsequent rises.
Investors should view these adjustments rationally and handle volatility through methods like reducing leverage and staged position building, while monitoring market sentiment and technical indicators.
WHY BULL MARKETS CRASH
After understanding why bull markets experience frequent crashes, how can we predict crashes and prepare in advance?
First, we need to fully understand the basic logic of each bull market surge: each rise is driven by more people and new capital entering the market.
When there are no more “newcomers” entering and existing “veterans” have no new capital, with most in “full positions,” this might indicate a cyclical top, and a crash may be imminent.
Then, based on this logic, we can reasonably reference some data indicators to make our judgments more accurate, such as:
First, we can analyze data and monitor markets on third-party platforms like Glassnode, CryptoQuant, and Coinank, regularly checking changes in the following indicators:
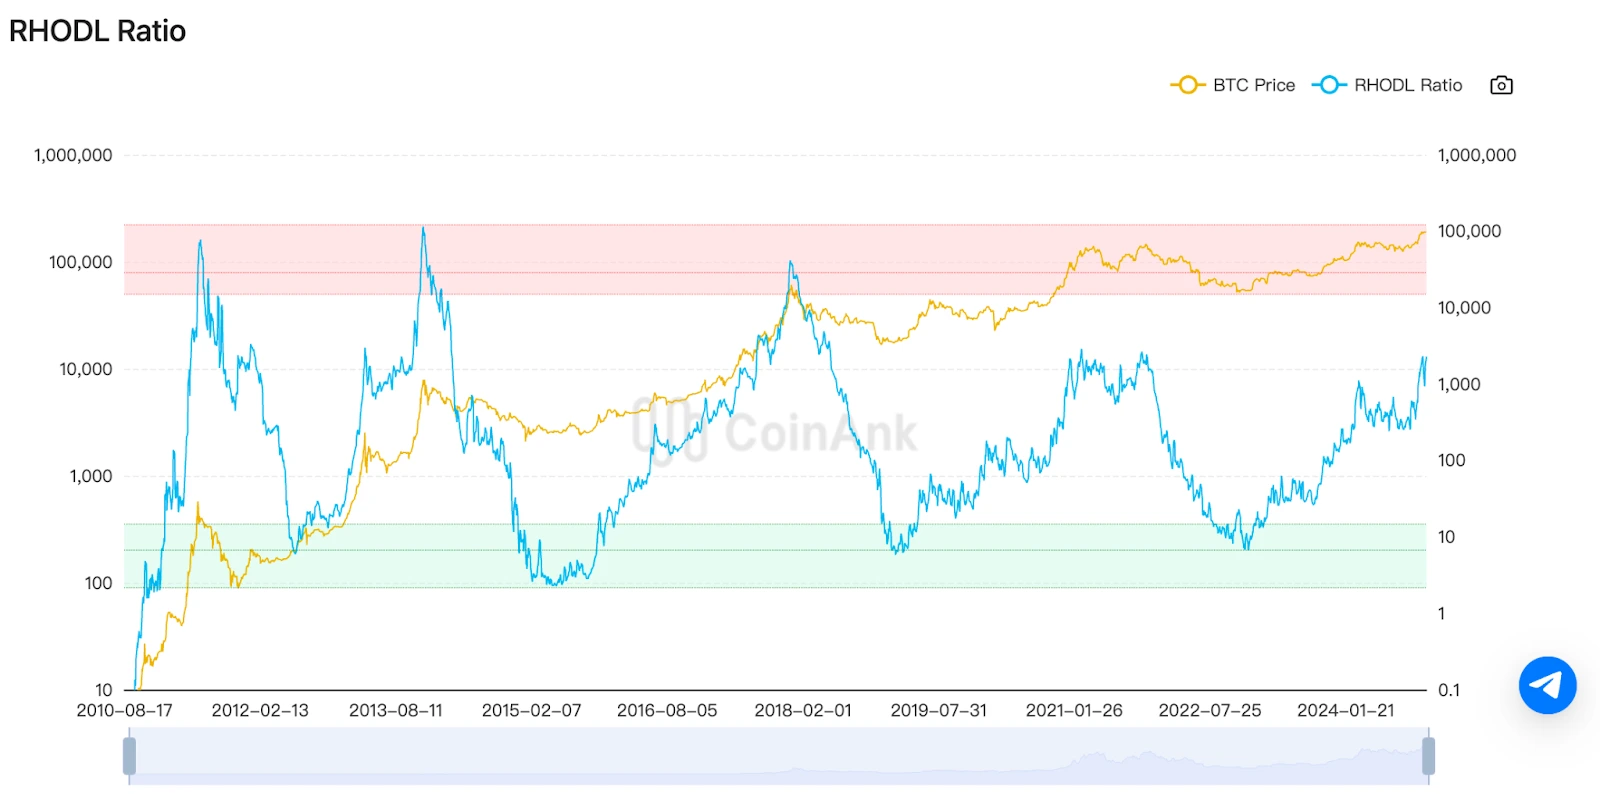
1. RHODL ratio: When the indicator enters the red band, it suggests the market is approaching a cycle top.
(Source: CoinAnk)
2. AHR999x Top Signal: Below 0.45 indicates a bull market top or cyclical top.
3. MVRV indicator: Higher values indicate severe price overvaluation and higher risk. Above 3.5 indicates excessive bubble formation.
4. Fear & Greed Index: The higher the value (closer to 100), the more greedy the market. The longer greed persists, the higher the crash risk.
5. Bitcoin-related data:
- Bitcoin market dominance and turnover rate: Lower dominance approaches bull market top, generally 30%-40% indicates high risk; higher turnover rate, especially significant increases after major rises, indicates higher crash risk.
- Percentage of coins held >1 year: Below 45% indicates high-risk zone.
- Bitcoin active addresses and new addresses: Significant increases or decreases while Bitcoin price is relatively high may indicate downside risk.
6. Fund inflow/outflow values: Large-scale outflows or numerous large sell orders indicate crash risk.
7. Bitcoin Rainbow Chart: Entering the orange-red top area indicates high bubble risk.
8. Puell Multiple indicator: Explores market cycles from mining revenue perspective; values between 4-10.5 indicate current market greed and possible late bull market phase.
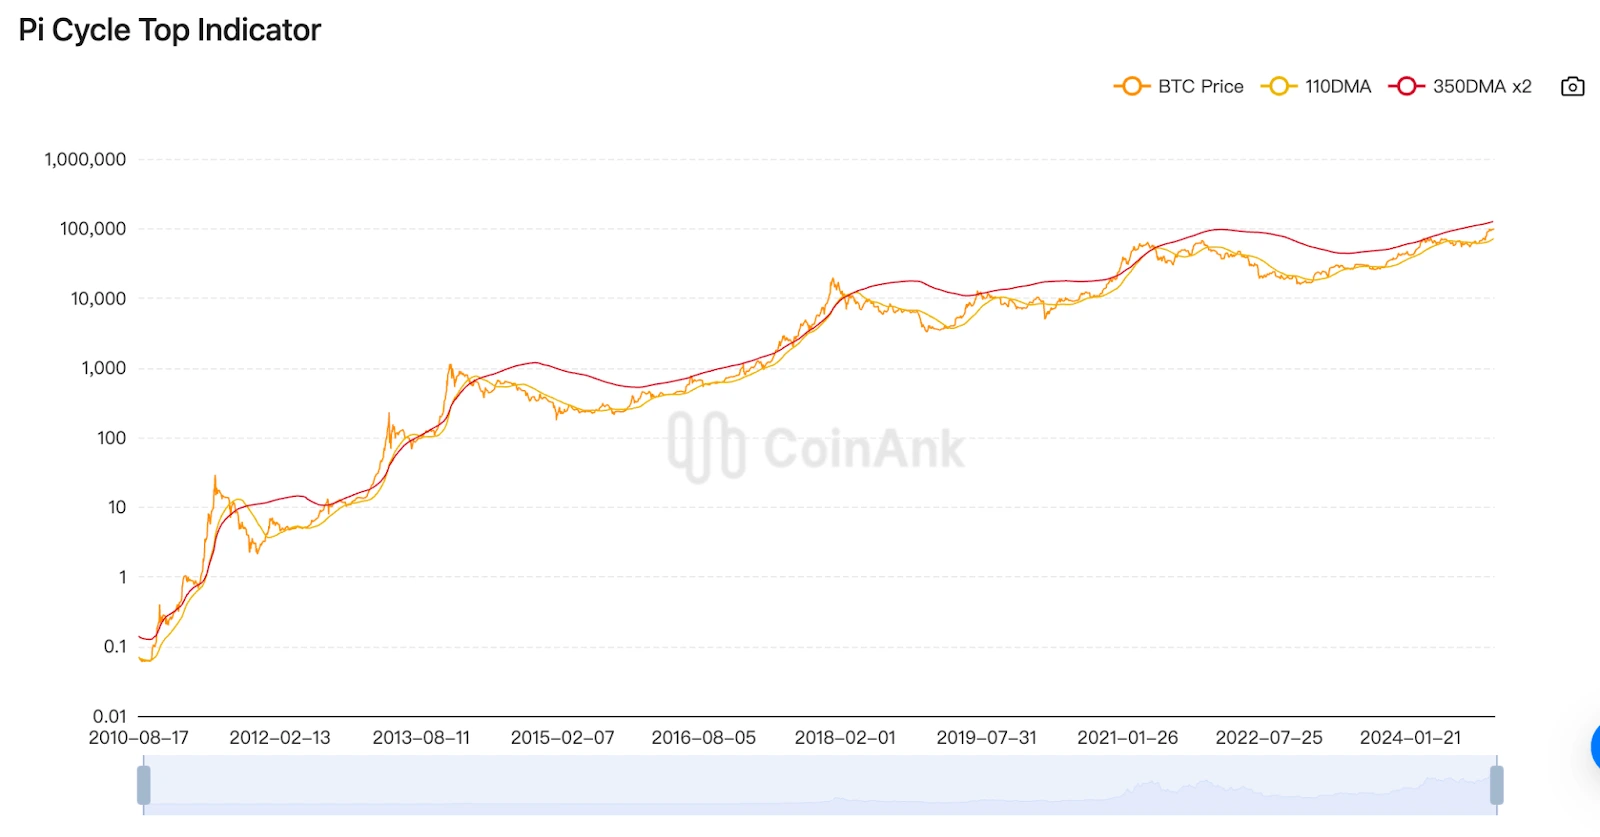
9. Pi Cycle Top indicator: When 111DMA moves up and crosses 350DMA x 2, it indicates a cycle top.
(Source: CoinAnk)
Second, we need to learn some technical analysis knowledge, mainly:
1. Breaking key support levels: Support levels are areas where prices resist falling; effective breaks often indicate shifting market sentiment toward bearishness and possible mass selling.
2. Technical indicator overbought conditions and divergence RSI (Relative Strength Index): When RSI exceeds 70, the market is overbought and prices may face correction pressure; Divergence: When price makes new highs but RSI doesn’t follow, it shows weakening momentum and possible drops.
3. Volume and price divergence: Healthy uptrends need volume support. If prices continue rising but volume decreases, it may indicate weakening buying pressure and possible corrections.
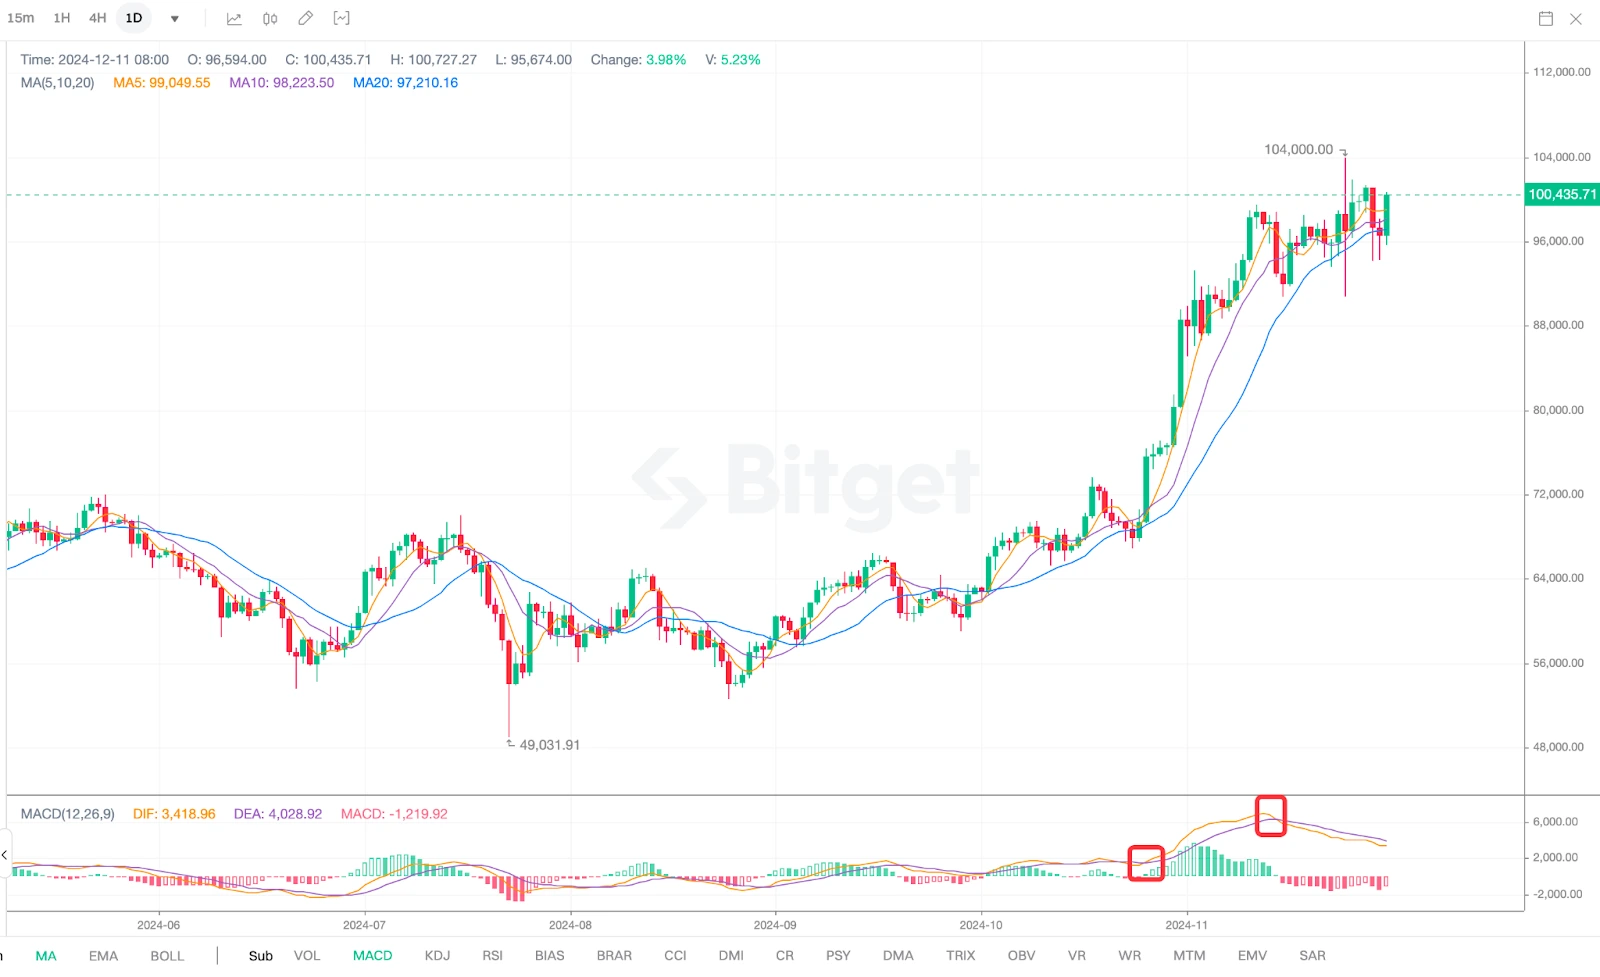
4. MACD death cross: When MACD fast line (short-term moving average) crosses below the slow line (long-term moving average), creating a “death cross,” it usually predicts trend reversal or beginning of decline.
MACD Golden Cross and Death Cross
(Source: Bitget)
5. Bollinger Band breakout and return: Bollinger Bands consist of upper, lower, and middle bands, with price moving within range. If price breaks above upper band then quickly falls, it may be a false breakout predicting market correction.
6. Falling wedge breakout: Falling wedge is a continuation pattern. If price breaks below wedge bottom, it often predicts larger drops ahead.
Third, pay attention to major financial events We’ve discussed this in detail in our previous article: “Crypto Market December Outlook: Key Events and Market Catalysts for Year-End 2024.” Here we’ll just list some third-party websites for your reference and study:
- TRADING ECONOMICS Provides global financial data including national economic indicators, stock markets, bond yields, inflation rates, etc., useful for economic analysis and investment decisions.
- Bloomberg Leading global financial market data platform providing real-time financial news, stock and bond data, and in-depth market analysis.
- Yahoo Finance Provides global stock, forex, futures market data, plus portfolio tracking tools and financial news.
- CEIC Provides global macroeconomic data, industry data, and national economic development trends, covering political, social, fiscal aspects.
Note that there are many more market data indicators available for reference. These are just some common examples.
All these data indicators ultimately need human interpretation and aren’t absolutely correct. You can choose some to study deeply and understand their underlying logic to help better predict crashes.
CONCLUSION AND NEXT STEPS
After reviewing the above content, we can understand how the market will move: oscillating to repair market sentiment, then Bitcoin rapidly rising, followed by sector rotation rises, attracting retail FOMO buying, market frenzy, crash arrival, and another cycle of ups and downs begins.
Here, we mainly want to discuss how to identify quality coins for priority buying after this crash: Look for coins that fell relatively less during this crash for priority purchase. As they say, real gold fears no fire, and this crash indirectly helped us verify coin quality. For example:
ETH dropped from $4,087 high to $3,509 low, -14.1%;
SOL from $264 to $203, -23.1%;
ICP from $15.6 to $10.7, -31.4%;
FIL from $8.4 to $5.5, -34.5%;
XRP from $2.91 to $1.9, -34.7%;
DOGE from $0.484 to $0.365, -24.6%;
PEPE from $0.000028 to $0.000021, -25%;
SUI from $4.49 to $3.35, -25.4%;
SHIB from $0.0000334 to $0.0000241, -27.8%;
UNI from $19.47 to $14.03, -27.9%;
It’s clear that higher market cap and more mainstream coins are more resilient to drops. Of course, when investing in specific coins, we should also consider our capital amount and risk tolerance.
Higher market cap coins tend to have more stable returns but possibly lower subsequent gains.
If you’re a retail investor with small capital seeking higher returns, you’ll need to choose some smaller coins but must accept higher risk.
▶ Buy Crypto at Bitget


