


KEYTAKEAWAYS
- SUI is predicted to have three major upward waves from 2024-2025, potentially reaching $180-200 from an initial $1.5.
- Historical L1 blockchain performances, like ETH and SOL, provide insights into potential price patterns and correction ranges for SUI.
- Factors such as ecosystem development, market sentiment, and regulatory changes could significantly impact SUI's predicted bullish trajectory.
- KEY TAKEAWAYS
- SUI VS. LEGACY CRYPTO GIANTS: COMPARATIVE ANALYSIS OF BULL MARKET PERFORMANCES
- LEARNING FROM PAST CRYPTO CYCLES: DOT AND SOL’S PRICE TRAJECTORIES
- SUI’S 2024-2025 BULL RUN FORECAST: PREDICTING THREE MAJOR UPWARD WAVES
- RISK FACTORS AND MARKET DYNAMICS: WHAT COULD ALTER SUI’S BULLISH TRAJECTORY
- DISCLAIMER
- WRITER’S INTRO
CONTENT
Analyze SUI’s potential price trajectory in the 2024-2025 bull market, comparing it with past L1 blockchain performances. Explore three predicted upward waves and factors that could impact SUI’s bullish trend.
In our previous article: “Top Public Blockchain Projects to Watch in the 2024 Crypto Bull Market“, we mentioned that each bull market has one or more L1 blockchains that become extremely popular and lead market trends. For example, ETH in 2017, EOS in 2018, ATOM in 2019, LUNA and DOT in 2021, and SOL, TON, and TIA in 2024.
These L1 blockchains not only greatly promote the emergence and explosion of new concepts in the crypto market such as DeFi, NFT, and GameFi, but also significantly increase the value of their native tokens in the process. Price increases of tens or hundreds of times make them the focus of investors’ attention.
So in the upcoming fourth Bitcoin halving cycle, how will the price of SUI, one of the most noteworthy L1 blockchain projects in this round, move? How will it pump and dump? What will be its ultimate price? Let’s compare it with the trends of other L1 blockchains in previous bull markets to make a rough judgment, which can help in formulating investment strategies.
SUI VS. LEGACY CRYPTO GIANTS: COMPARATIVE ANALYSIS OF BULL MARKET PERFORMANCES
First is ETH, the king of L1 blockchains. 2017 was truly ETH’s breakout year, establishing its position as the king of L1 blockchains and driving the explosion of the L1 blockchain concept in 2018 and subsequent bull markets.
In the 2017 bull market, ETH rose from a low of $8 at the beginning of the year to a high of $1,448 in this round, an increase of 18,000% (TradingView data), with unparalleled popularity. However, ETH’s rise was not smooth sailing, with multiple instances of dramatic ups and downs. For example, there were 12 instances of daily increases exceeding 15%, and 7 instances of daily decreases exceeding 15%. These dramatic fluctuations mainly occurred during periods of high market sentiment in several main upward waves and major correction periods.
ETH price trend 2016-2023
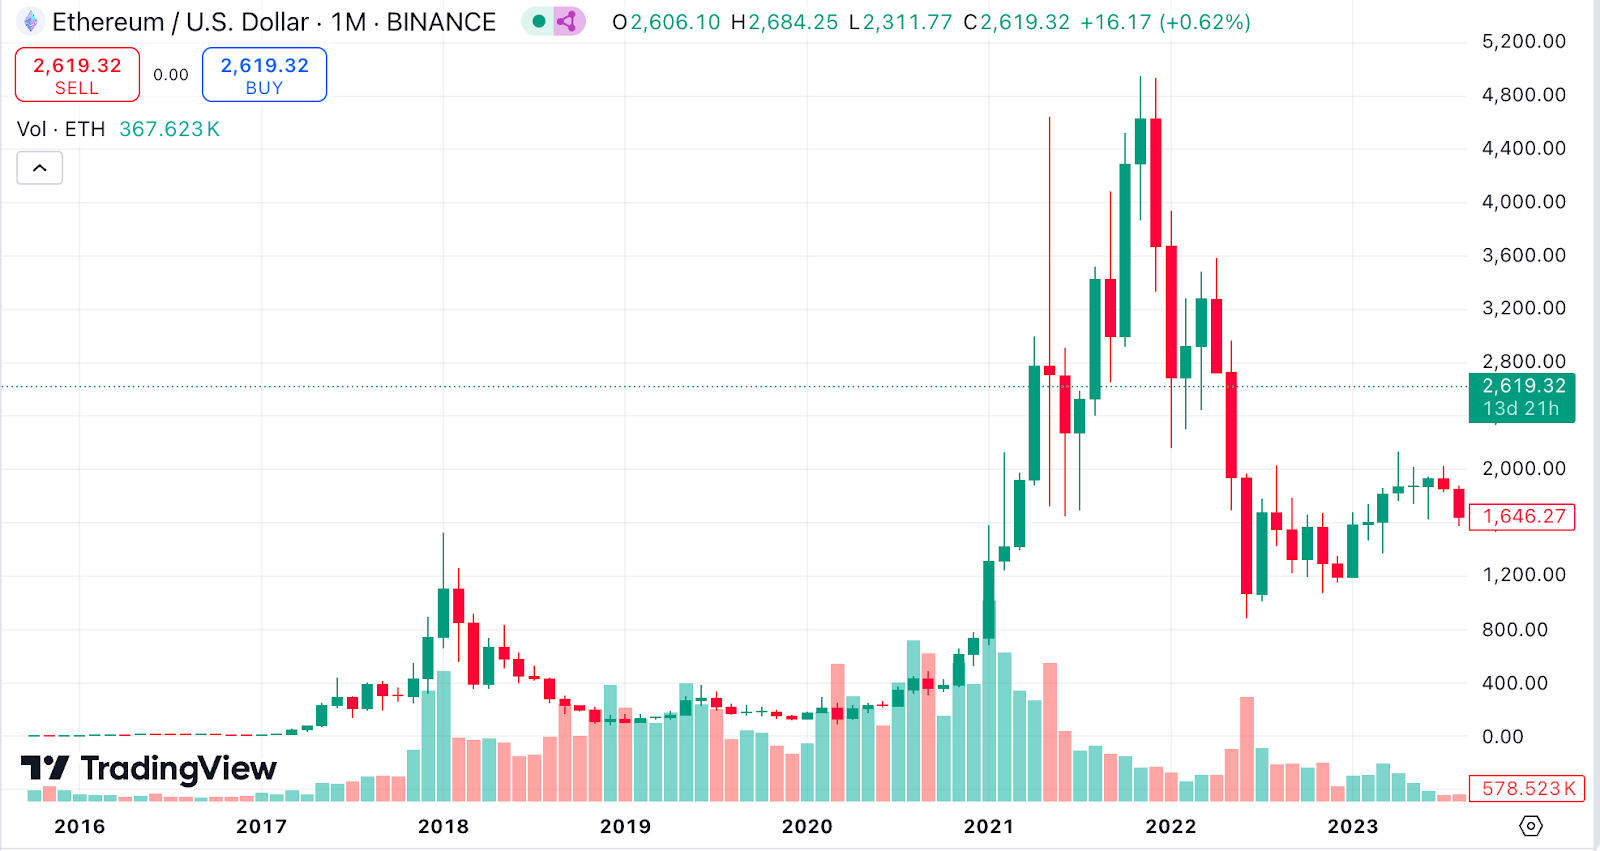
(Source: TradingView)
In 2017, ETH experienced 3 distinct upward waves, each with different durations, gains, corrections, and consolidation periods. For example, the first upward wave lasted from January to June, lasting 5 months, rising from $8 to $400, a gain of about 4,900%; followed by a 2-month correction and consolidation, with ETH price retreating to around $150, a correction of about 60%.
The latter two upward waves lasted 2 months and 1 month respectively, with smaller gains and corrections than the first wave. Overall, ETH had 1 to 2 months of consolidation between each upward wave in 2017, with 40%-60% correction ranges.
Exploring the reasons for ETH’s explosion in 2017, it can be mainly attributed to: the ICO craze, widespread application of smart contracts, market sentiment and bull market atmosphere, expansion of the Ethereum developer community, and unclear global regulations. These factors also became the biggest influences on subsequent market trends.
Compared to ETH’s explosion in the 2017 bull market, SUI’s current macro environment has changed significantly. However, the annual gains, daily gains/losses, and correction ranges can still serve as references for investors. Let’s continue to review other L1 blockchain projects.
EOS in 2018 was one of the most watched projects in the entire crypto market. It went through a complete bull and bear cycle in just one year, first rising from $8 to $23, a 187% increase, and then due to the end of the bull market and issues with its own development process and ecosystem building, it plummeted to $1.55 by the end of the year.
EOS price trend 2018-2024
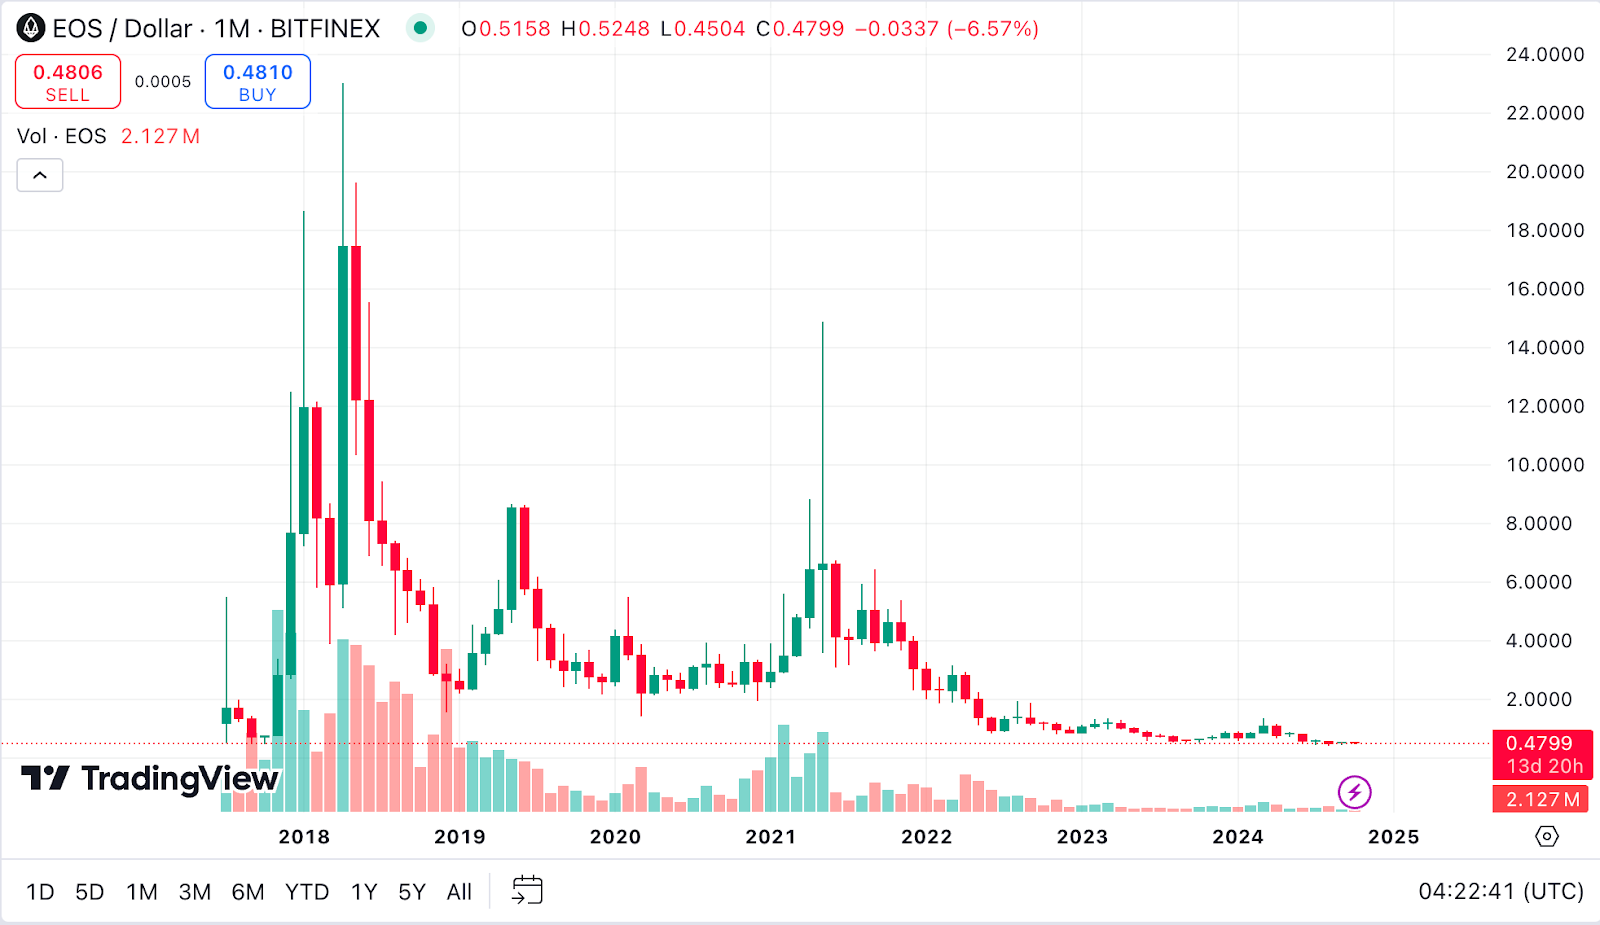
(Source: TradingView)
EOS can be said to be a typical L1 blockchain project that started high and ended low. Analyzing it as a negative example might be more useful as a warning to SUI investors. For instance, exploring the reasons for its rapid fall, which mainly include bear market pressure, disappointment after mainnet launch, investor selling pressure, and tightening global regulations. These factors could also occur in SUI’s subsequent rise. As the saying goes, “Plan for failure before planning for success.” In the crypto market, risk awareness and bottom-line thinking might be more important than studying the project itself.
In 2021, LUNA might be the project that crypto market investors find hardest to let go of. Due to the success of the algorithmic stablecoin UST and the rapid expansion of the Terra ecosystem, LUNA’s price experienced a significant increase in 2021, rising from a low of $0.65 to a high of $103.33, a maximum increase of 158 times. Its market cap surpassed all competitors at the time such as SOL, AVAX, and DOT, second only to ETH, the king of L1 blockchains.
However, subsequently, due to the UST de-pegging event, the entire Terra ecosystem collapsed, and LUNA’s price quickly crashed. Many investors lost 90% of their assets overnight. The candlestick chart below shows how devastating the losses were for LUNA investors at the time.
LUNA price trend 2020-2024
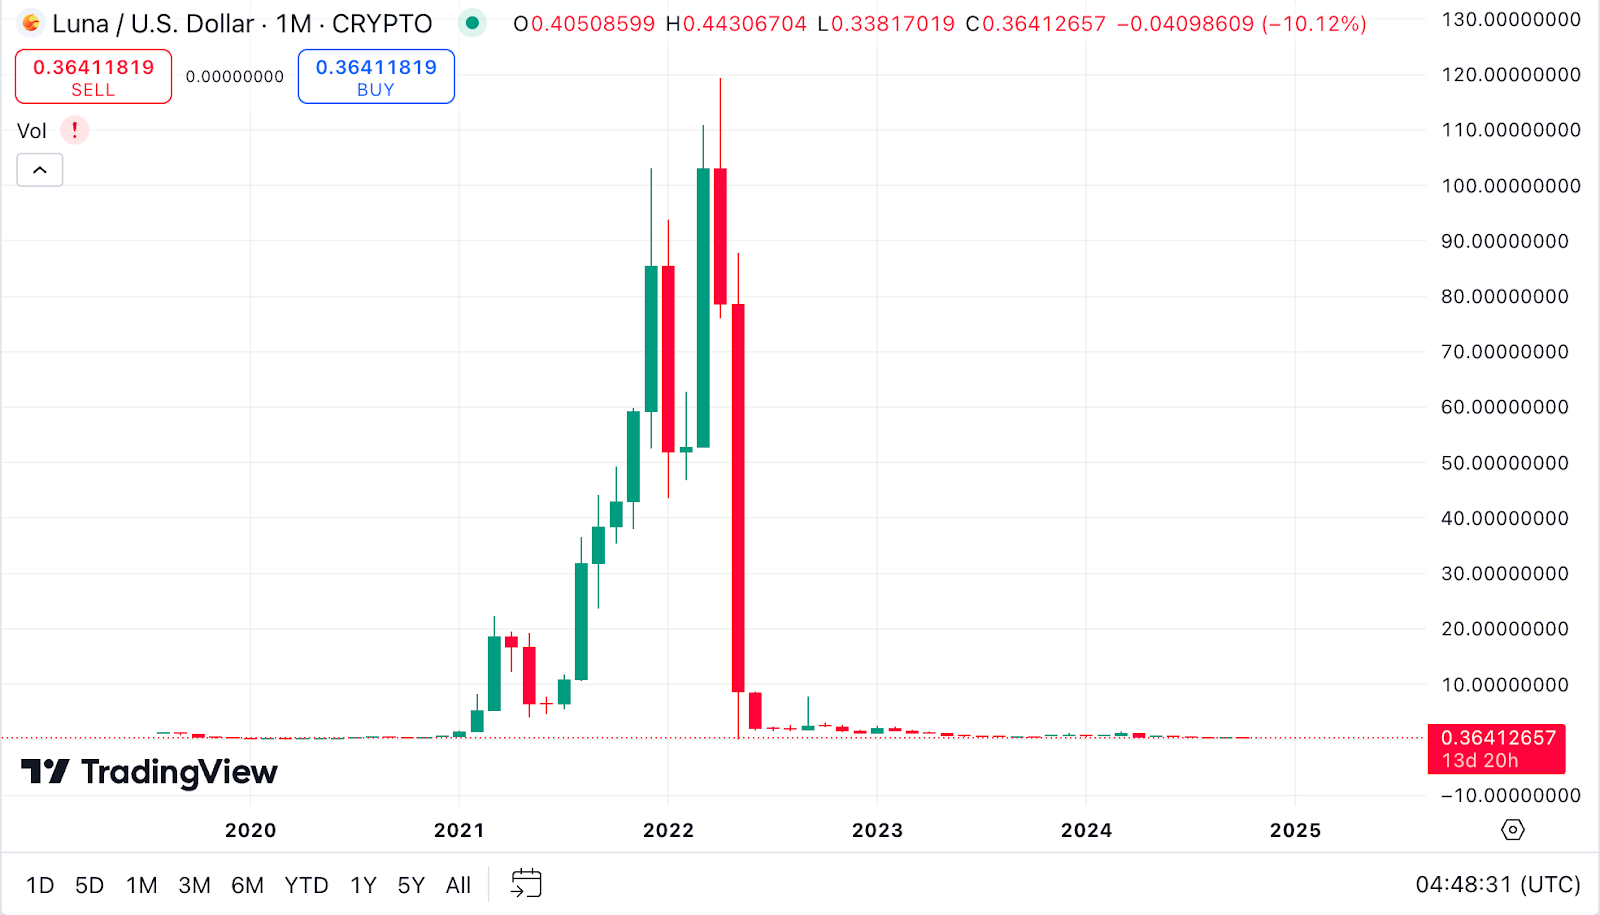
(Source: TradingView)
Of course, as a L1 blockchain project with both positive and negative experiences to learn from, there are still some aspects of LUNA worth mentioning: During LUNA’s massive surge in 2021, there were 15 instances of daily gains and 7 instances of daily losses exceeding 15%; like ETH in 2017, it experienced three main upward waves, with 1-2 months of consolidation between each wave, and correction ranges typically between 60%-76% after each upward wave.
The reasons for LUNA’s rapid downfall are also worth learning from, such as the de-pegging event of its flagship UST, which exposed the systemic risks of algorithmic stablecoins, and the over-leveraged DeFi ecosystem on its chain. When buying into a L1 blockchain project, we also need to remain vigilant about the fragility of the project’s internal mechanisms.
LEARNING FROM PAST CRYPTO CYCLES: DOT AND SOL’S PRICE TRAJECTORIES
In 2021, DOT was another hot L1 blockchain project, rising from a low of $9.27 at the beginning of the year to a high of $55.08 within the year, a 494% increase. It also experienced three main upward waves, with 6 instances of daily gains and 4 instances of daily losses exceeding 15% during this uptrend; there were 1-2 months of consolidation between each upward wave, with correction ranges typically between 34%-73% after each upward wave.
DOT price trend 2021-2024
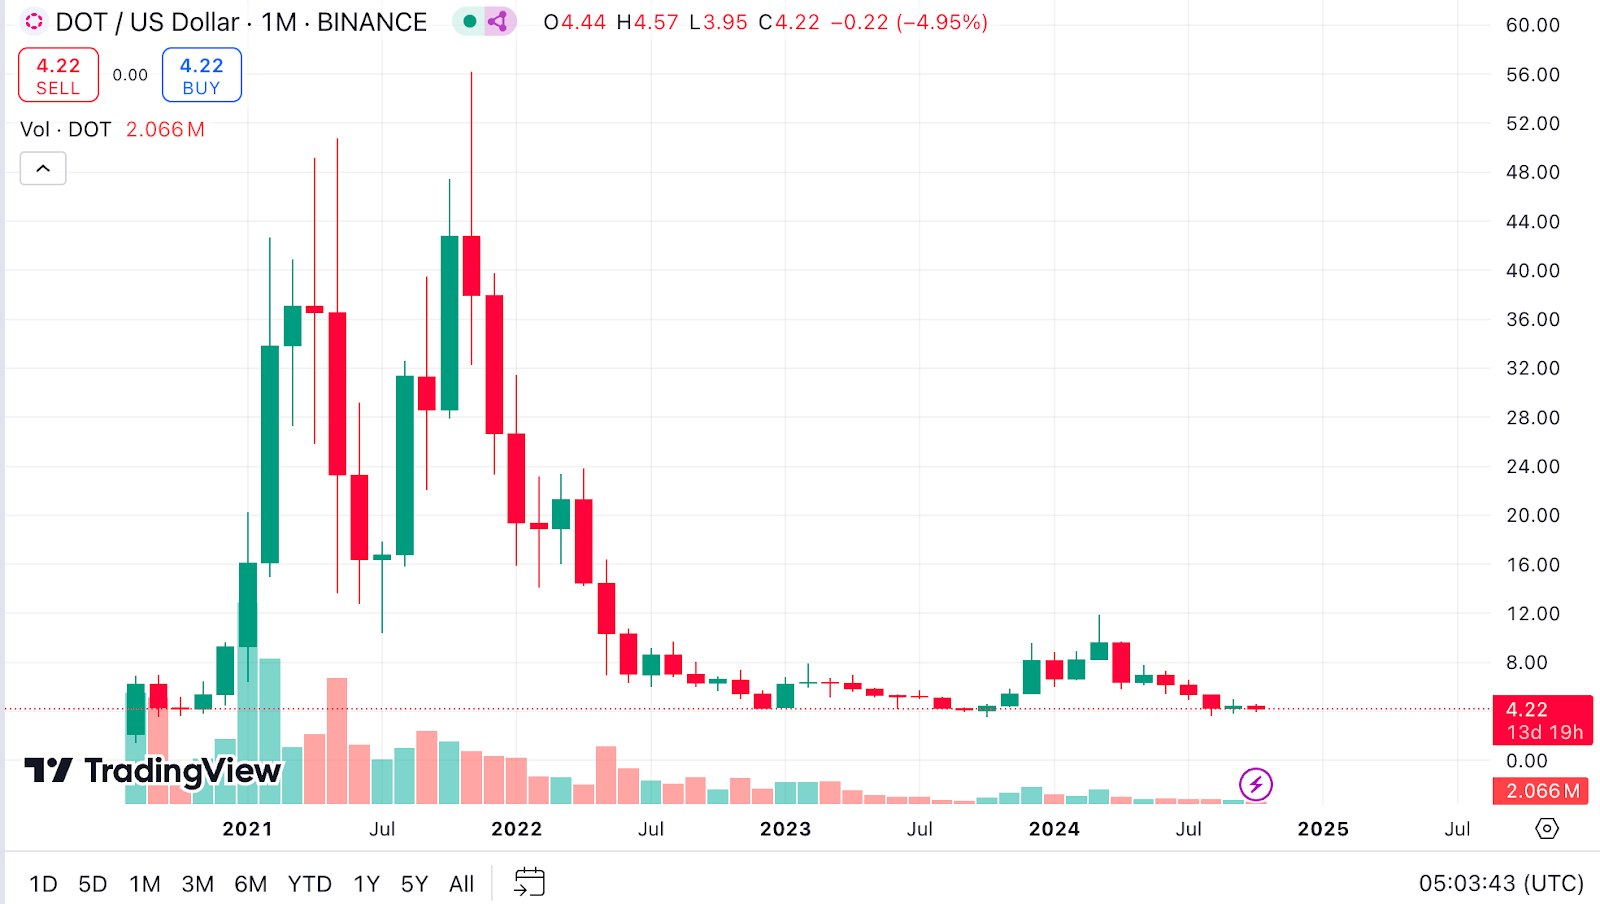
(Source: TradingView)
The main driving forces behind DOT’s rise that year were: the launch of Polkadot parachain auctions, growing demand for cross-chain interoperability, support from institutional investors, and the overall bull market atmosphere.
SOL, as the most watched L1 blockchain project this year, is a typical case of “an old tree blooming new flowers”, rising from last year’s bear market bottom of $8 to this year’s high of $210, a 2,500% increase. This growth rate is absolutely among the best in the current fourth halving cycle, which hasn’t fully unfolded yet.
SOL price trend 2022-2024
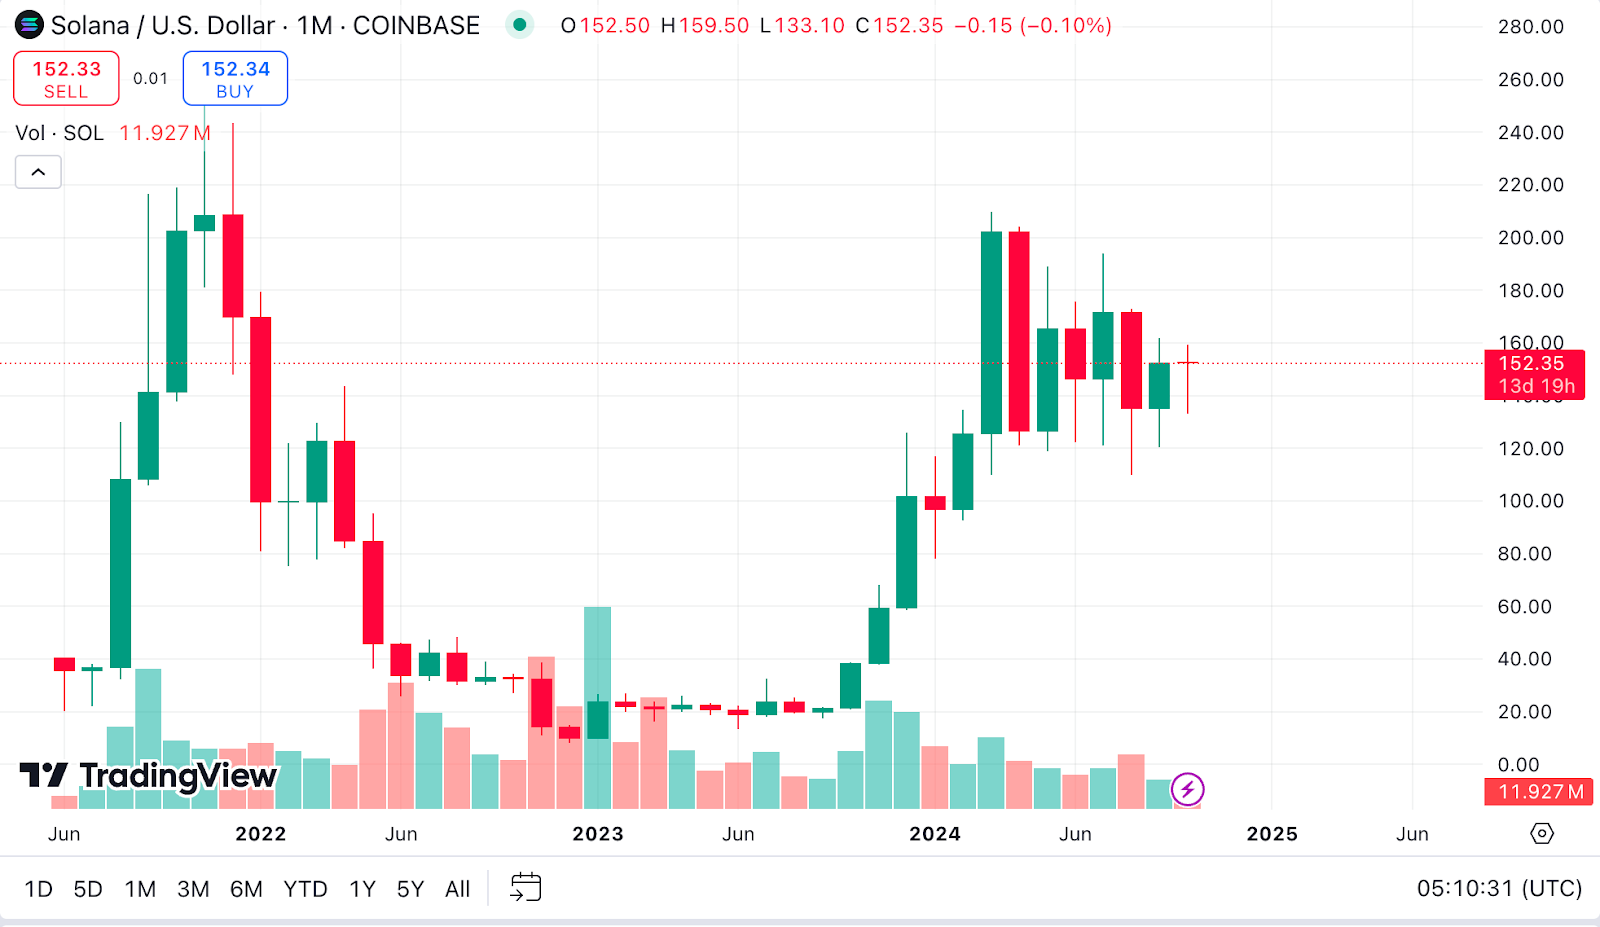
(Source: TradingView)
SOL, as an old L1 blockchain project, has once again become the star of L1 blockchain projects, mainly thanks to its technological advantages of high throughput and low transaction fees, continuous optimization and expansion of its ecosystem, support from institutional investors, and growth in on-chain activities. Of course, more importantly, it’s also due to the recovery of the crypto market sentiment from late last year to early this year.
SUI’S 2024-2025 BULL RUN FORECAST: PREDICTING THREE MAJOR UPWARD WAVES
After comparing the popular L1 blockchain projects in previous bull markets, let’s make a rough prediction of SUI’s performance in this halving cycle:
Firstly, due to the big bull market conditions, as a standard feature of big bull markets, SUI will have at least 3 major upward waves in this cycle, similar to ETH in 2017, LUNA and DOT in 2021. However, because this halving cycle sees a more mature overall crypto market, coupled with the approval of Bitcoin spot ETFs and large-scale institutional involvement, this bull market might be a slow bull market. In other words: the duration of the bull market will increase, but the number of dramatic ups and downs will decrease. Therefore, the consolidation time after each upward wave will increase, but the correction range will also decrease.
Based on the above judgments, and the interpretation in the previous article: “Will the L1 Blockchain Sui Increase 100 Times in the 2025 Halving Bull Market?“, here’s a prediction of SUI’s price movement from October 2024 to December 2025:
October 2024 – March 2025, as the first major upward wave, also the time for the crypto market bull run to start and SUI’s own ecosystem to enrich, it might rise from a low of $1.5 to between $15-20, a 10-fold increase over more than 5 months; then a 1-2 month correction and consolidation, with a minimum correction to around $8-10, a 50% correction range.
May 2025 – August 2025, as the second major upward wave, also possibly the time when this halving cycle enters a frenzied phase, SUI might rise from the correction low of $8-10 to between $100-120, a maximum increase of about 14 times over 4 months; at that time, due to the market’s frenzy, the correction and consolidation period might last at least 2 months, with a minimum correction to between $60-72.
November 2025 – December 2025, as the third major upward wave, which might also be the last wave of this halving cycle, the market enters the final sprint stage, but due to SUI’s previous surge, its market cap will already be quite large, so the increase won’t be too significant, possibly rising from the correction low of $60-72 to between $180-200, a 2-3 times increase.
RISK FACTORS AND MARKET DYNAMICS: WHAT COULD ALTER SUI’S BULLISH TRAJECTORY
Then the fourth halving cycle of the crypto market might end, at which point profit-taking and securing gains would be necessary. Of course, market developments will be influenced by many factors, including but not limited to: SUI’s own ecosystem building, market FOMO sentiment, regulatory policies, the broader economic environment such as the Fed’s rate cut pace and global economic conditions, and even potential black swan events. These factors could all disrupt the above predictions.
Finally, all content in this article represents the author’s personal views, is for reference only, and does not constitute investment advice.
▶ Buy Crypto at Bitget
CoinRank x Bitget – Sign up & Trade to get $20!