KEYTAKEAWAYS
- Federal Reserve policies directly influence crypto markets; rate hikes and balance sheet reduction typically pressure Bitcoin prices, while accommodative policies often fuel bull markets.
- Inflation indicators (CPI/PCE) affect crypto by shaping Fed decisions; high inflation prompts tightening that reduces market liquidity, while lower inflation supports risk assets.
- The Dollar Index inversely correlates with Bitcoin; a strengthening dollar typically pressures crypto prices, while dollar weakness often coincides with Bitcoin appreciation.

CONTENT
Discover how economic indicators like Fed rates, CPI/PCE, NFP, and USD Index impact cryptocurrency markets. Learn to interpret these data points to anticipate Bitcoin price movements in varying market conditions.
In the crypto world, we often see certain data indicators appearing alongside dramatic market movements in news reports, as if changes in these indicators directly cause market fluctuations. These indicators include the VIX index, interest rates, CPI, NFP, Dollar Index, and others.
In fact, as Bitcoin becomes increasingly connected to the traditional world, it is more and more influenced by it. Traditional economic and monetary indicators to some extent determine Bitcoin’s short-term or long-term price movements.
So how do these data indicators influence Bitcoin’s price movements? What’s the underlying logic? And how should we use these indicators to anticipate future movements in Bitcoin and the crypto market?
CENTRAL BANK INTEREST RATES AND BALANCE SHEET REDUCTION/EXPANSION
The monetary policies of the world’s three major central banks—the Federal Reserve, the European Central Bank, and the Bank of England—as well as central banks in Japan, Canada, and other major economies have an almost decisive impact on bull and bear cycles in the crypto market. We’ll use the Federal Reserve as an example to interpret monetary policy, focusing on two key aspects: interest rate changes (rate hikes/cuts) and balance sheet changes (reduction/expansion).
1. Federal Reserve Interest Rates
The Federal Reserve (Fed) influences short-term borrowing costs in the market through the federal funds rate. This rate is set by the FOMC (Federal Open Market Committee) and serves as the benchmark rate for overnight interbank lending. The Fed holds 8 rate-setting meetings annually, with one meeting per quarter.
Its main function is determining the cost of capital and liquidity levels, which in turn affect consumption, investment, and economic growth. Interest rate hikes typically indicate an overheating economy or inflationary pressure, while rate cuts suggest economic weakness requiring stimulus.
Key focus areas: Interest rate decisions and dot plots, paying attention to FOMC meeting statements and officials’ rate forecasts; liquidity indicators such as Federal Reserve balance reserves, repo market rates (SOFR), and TGA account changes.
Related data: Treasury yields, especially the 10-year US Treasury yield, indirectly reflect market expectations for economic outlook and inflation; macroeconomic data such as CPI, PCE, employment figures, etc., which influence the Fed’s policy decisions.
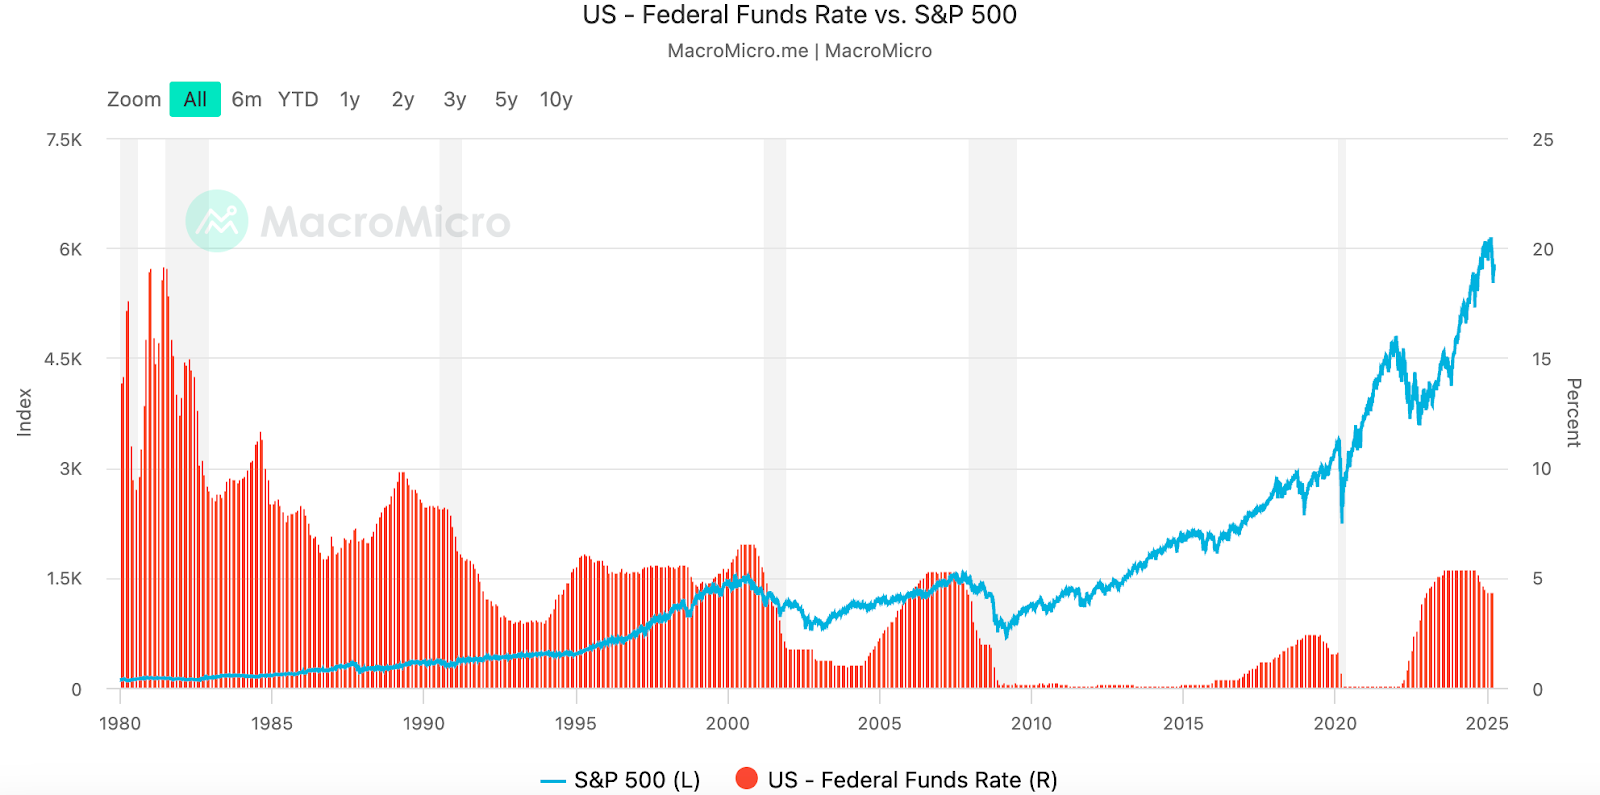
US benchmark interest rate vs. S&P 500
(Source: MacroMicro)
2. Balance Sheet Reduction and Expansion
Balance Sheet Reduction (Quantitative Tightening, QT): Refers to the Fed gradually reducing its balance sheet size by not rolling over maturing assets or actively selling assets, thereby withdrawing market liquidity. QT directly reduces market liquidity and may trigger risk asset sell-offs.
However, the Fed recently announced that it would slow the pace of QT from April (reducing the upper limit of Treasury bond reduction from $25 billion to $5 billion), which is an “implicit easing” that may alleviate liquidity pressure and provide short-term support for the crypto market. It’s important to monitor whether QT leads to inverted yield curves or increased term premiums, which could trigger cross-market volatility and indirectly affect cryptocurrencies.
Balance Sheet Expansion (Quantitative Easing, QE): Refers to the Fed’s large-scale purchase of Treasury bonds and other securities to expand its balance sheet size, inject liquidity into the market, and lower borrowing costs. QE is typically accompanied by market liquidity floods, pushing funds toward non-traditional assets like Bitcoin. Historically, the large-scale QE following the 2020 pandemic helped fuel the Bitcoin bull market.
3. How Does This Affect the Crypto Market?
Impact on Liquidity and Risk Appetite
Rate cuts/QE: Usually means increased market liquidity, lower capital costs, and potentially greater demand for risk assets (including cryptocurrencies), which could drive up crypto prices. Rate hikes/QT: May withdraw market liquidity, increase capital costs, and reduce investor risk appetite, leading to pressure on risk assets and potential adjustments or declines in the crypto market.
Impact on Market Sentiment
Fed policy changes often affect global capital market sentiment. As a high-volatility risk asset, the crypto market performance is influenced by macroeconomic policy expectations and capital flows. When policy expectations are unclear, markets often fall into risk-averse sentiment, and crypto price volatility increases; conversely, accommodative policies may bring bull market conditions.
4. Relevant Websites
Official and Authoritative Data Platforms
- Federal Reserve website: Publishes federal funds rates, FOMC meeting minutes, and balance sheet data.
- FRED: Provides real-time updates on various economic data from the St. Louis Fed.
Financial News and Data Platforms
- Bloomberg, Reuters: Provide the latest Fed policy, Treasury yields, and macroeconomic data.
- TradingView: View technical charts and monitor data indicators such as Treasury bonds, Dollar Index, etc.
Crypto-Specific Platforms
- CoinDesk, Cointelegraph: Report and interpret the impact of macroeconomics on the crypto sector.
- CryptoQuant, Glassnode: Provide on-chain data and capital flow analysis to help investors understand market sentiment and risks.
The Fed’s policy impact on the crypto market is not linear and requires comprehensive judgment based on multiple factors including liquidity changes, market sentiment, and macroeconomic environment. The current slowing of QT and potential rate cut expectations may provide short-term support for the crypto market, but investors should remain vigilant about risks from policy shifts, dollar strengthening, and cross-market volatility. Investors should maintain flexibility and closely follow the Fed’s policy path and economic data dynamics.
US CPI AND PCE
1. Definition and Differences
CPI (Consumer Price Index) measures price changes in household spending on consumer goods and services, including food, housing, transportation, healthcare, etc. It’s one of the main indicators of inflation, reflecting the rise and fall of overall price levels. It’s a key indicator measuring price changes for a basket of consumer goods and services, reflecting the inflation level. In addition to the overall CPI, “Core CPI” is typically monitored, which excludes food and energy items with more volatile prices, to more accurately reflect the underlying inflation trend.
PCE, or “Personal Consumption Expenditures Price Index,” is an indicator that measures price changes in goods and services actually consumed by consumers.
US CPI publication: Once monthly, the US Bureau of Labor Statistics (BLS) typically releases it in the second or third week; at 8:30 AM Eastern Time. US PCE publication: Once monthly, the US Bureau of Economic Analysis (BEA) typically also releases it in mid-month, at 8:30 AM Eastern Time.
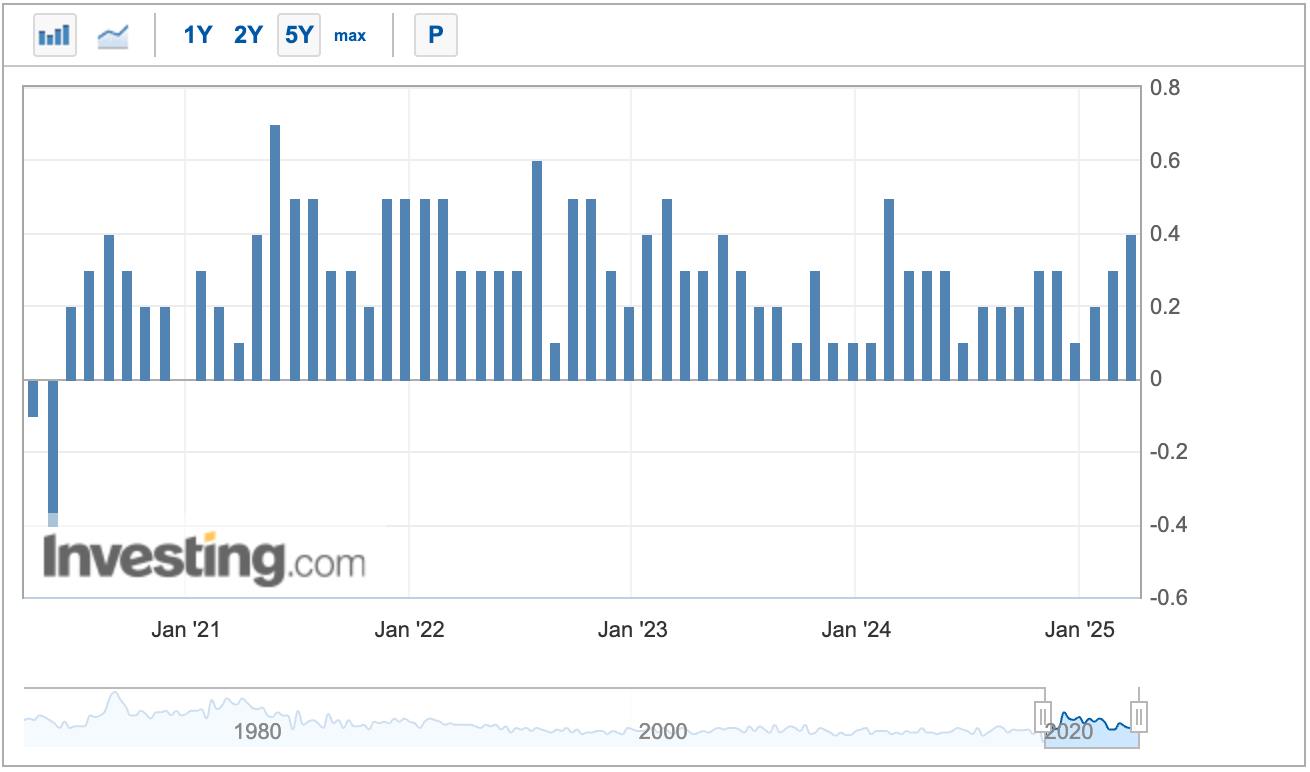
US Core PCE Price Index Month-over-Month
(source: Investing.com)
The main differences between the two are calculation methods and coverage. CPI calculation is based on a fixed consumer basket with fixed weights, not promptly reflecting changes in actual consumer spending. Its coverage mainly reflects prices directly paid by urban consumers, including food, housing, transportation, etc., focusing on measuring changes in living costs.
PCE calculation adopts a chain-weighted method that can dynamically adjust weights, reflecting consumer purchasing behavior and substitution effects. Its coverage includes not only prices directly paid by consumers but also portions paid by third parties (such as medical services paid by insurance), thus providing broader coverage and reflecting more comprehensive changes in consumer spending.
2. How Do They Affect the Crypto Market?
CPI and PCE data primarily influence the crypto market’s ups and downs by affecting the Fed’s monetary policy. The Fed generally sets an inflation target (usually close to 2%). CPI data above the target may prompt the Fed to raise rates and reduce its balance sheet, tightening monetary policy; conversely, data below the target may maintain accommodative policies or even lead to rate cuts. However, since PCE can more dynamically and comprehensively reflect actual consumer price changes, the Fed typically uses it as the main indicator for measuring inflation and as a basis for formulating monetary policy (such as rate hikes or cuts).
When PCE data rises, it usually indicates overall consumer price increases, which may prompt the Fed to adopt tightening policies (rate hikes/QT), increasing market capital costs and putting pressure on high-risk assets including Bitcoin. If PCE data is lower than expected, it indicates lower inflationary pressure, and the Fed may maintain accommodative policies, helping to increase market liquidity, which is favorable for crypto market conditions.
High CPI data (high inflation) typically indicates tightening monetary policy, leading the Fed to raise rates and reduce its balance sheet. This increases borrowing costs, withdraws market liquidity, putting pressure on risk assets including Bitcoin, and increasing the risk of decline. Low CPI data (low inflation) may prompt the Fed to maintain accommodative policies, with ample market liquidity helping risk asset prices rise.
Additionally, CPI data affects global economic expectations and investor sentiment. Under high inflation and tightening policy expectations, funds often flow to safe-haven assets (such as the dollar, bonds, gold), and some investors may view Bitcoin as an inflation hedge, but overall risk appetite decreases. In an accommodative policy environment, the market is more interested in high-risk assets, and Bitcoin may benefit from rising prices.
3. Relevant Websites
- US Bureau of Labor Statistics (BLS)
- Official PCE data
- Bloomberg, Reuters: Provide real-time economic data and interpretation.
- Trading Economics, Investing.com: Display historical and real-time CPI data charts.
- CoinDesk, Cointelegraph: Interpret the impact of macroeconomic data on the crypto market.
US NON-FARM PAYROLLS
1. Definition:
The US Non-Farm Payrolls (NFP) index, or the US Non-Agricultural Employment Index, is a key economic indicator released by the US Bureau of Labor Statistics (BLS), counting the number of new jobs added in a month across all industries except agriculture, private households, and government departments.
It reflects the development of US manufacturing and service industries, is an important indicator of whether the US economy is functioning well, and directly relates to Fed monetary policy. Monetary policy decisions directly affect the dollar’s trend, which is equally important for digital assets. Therefore, every day when the NFP index is released, it causes a major earthquake in global financial markets with massive fluctuations, and the evening is known as “NFP night.”
NFP data is typically released at 8:30 AM Eastern Time on the first Friday of each month.
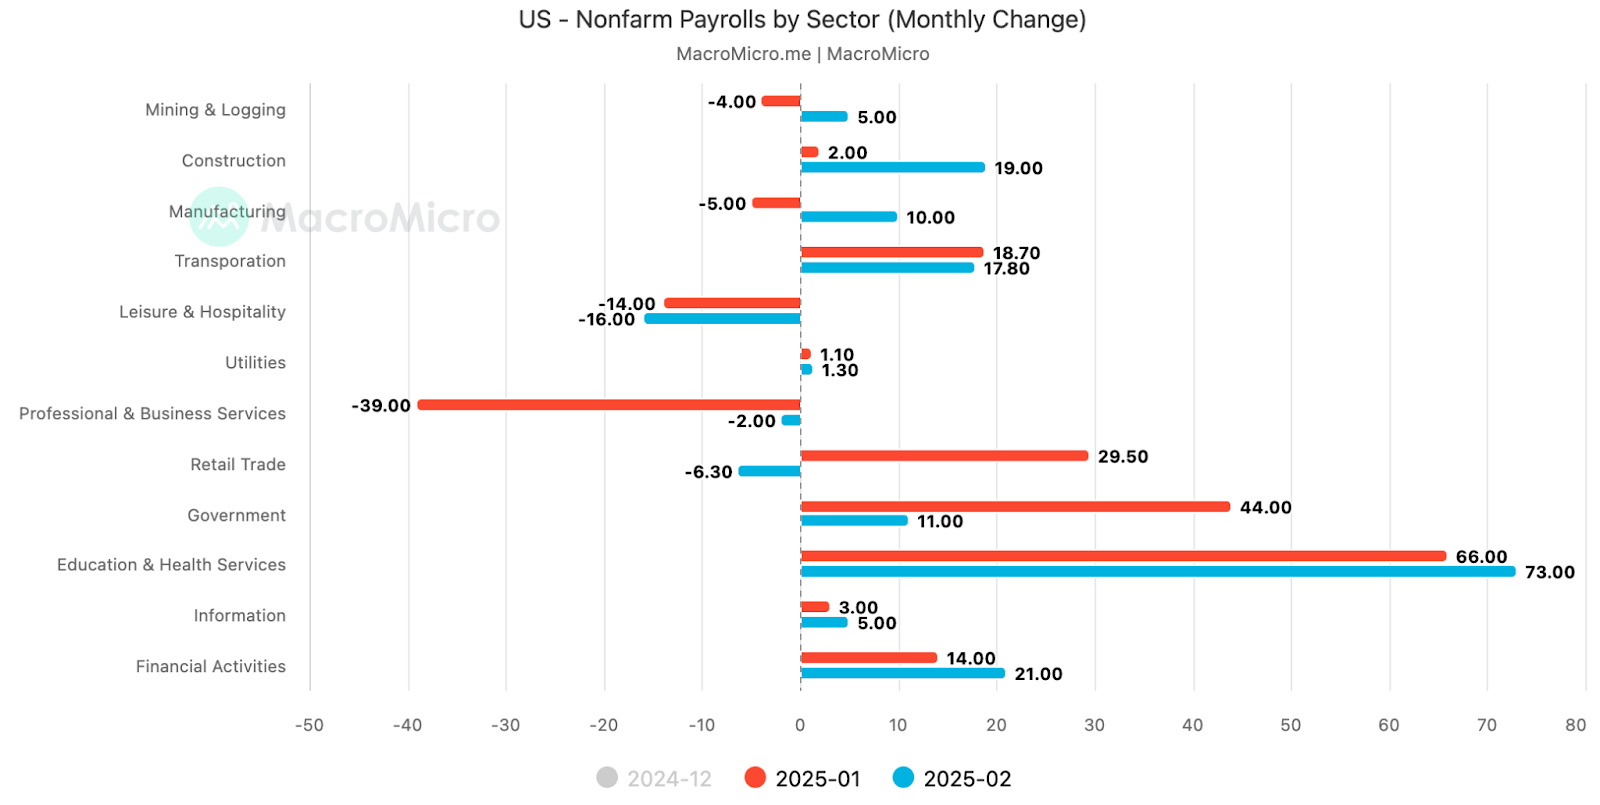
US NFP Monthly Change
(Source: MacroMicro)
2. How Does It Affect the Crypto Market?
Generally, NFP data is the first important economic data released each month. It reflects the development of US manufacturing and service industries, is an important indicator of whether the US economy is functioning well, and directly relates to Fed monetary policy, which in turn affects crypto market fluctuations.
Based on historical data, NFP employment maintaining above 100,000 means unemployment won’t rise; above 150,000, unemployment will continue to decline; above 200,000, the labor market will be considered very strong.
Strong NFP data: Shows an active job market, may indicate economic overheating, prompting the Fed to adopt tightening monetary policies (such as rate hikes or QT). This leads to increased capital costs, reduced market liquidity, putting pressure on Bitcoin and other cryptocurrencies.
Weak NFP data: May trigger market concerns about economic weakness, prompting the Fed to adopt accommodative policies (such as rate cuts or QE), increasing liquidity and lowering borrowing costs, indirectly benefiting the crypto market.
3. Relevant Websites
- US Bureau of Labor Statistics (BLS)
- Bloomberg, Reuters: Provide real-time data and detailed interpretation.
- Trading Economics, Investing.com: Display historical and real-time employment data charts.
- CoinDesk, Cointelegraph: Focus on the impact and interpretation of macroeconomic data on the crypto market.
As an important indicator of the US labor market, NFP data is released on the first Friday of each month. Its fluctuations not only directly affect Fed monetary policy decisions but also indirectly affect the prices of Bitcoin and other crypto assets through market sentiment and global capital flows. Crypto investors should closely monitor NFP data and related economic indicators to better grasp the potential impact of macroeconomic environment changes on the crypto market.
US DOLLAR INDEX (DXY)
1. Definition
The US Dollar Index (DXY) is a comprehensive indicator calculated by weighting exchange rates between the US dollar and other major currencies, typically calculated using geometric averaging.
It’s an indicator measuring the dollar’s value change relative to a basket of major foreign currencies (typically including the euro, yen, pound, Canadian dollar, Swedish krona, and Swiss franc), reflecting the dollar’s overall strength or weakness. It’s an important tool for measuring the dollar’s international purchasing power and is updated in real-time during global forex market trading hours.
Trading hours: DXY data is continuously updated during normal US stock and global forex market trading sessions (typically in a 24-hour market, with the US trading session being particularly active). Investors can view real-time data through trading platforms or financial news websites.
2. How Does It Affect the Crypto Market?
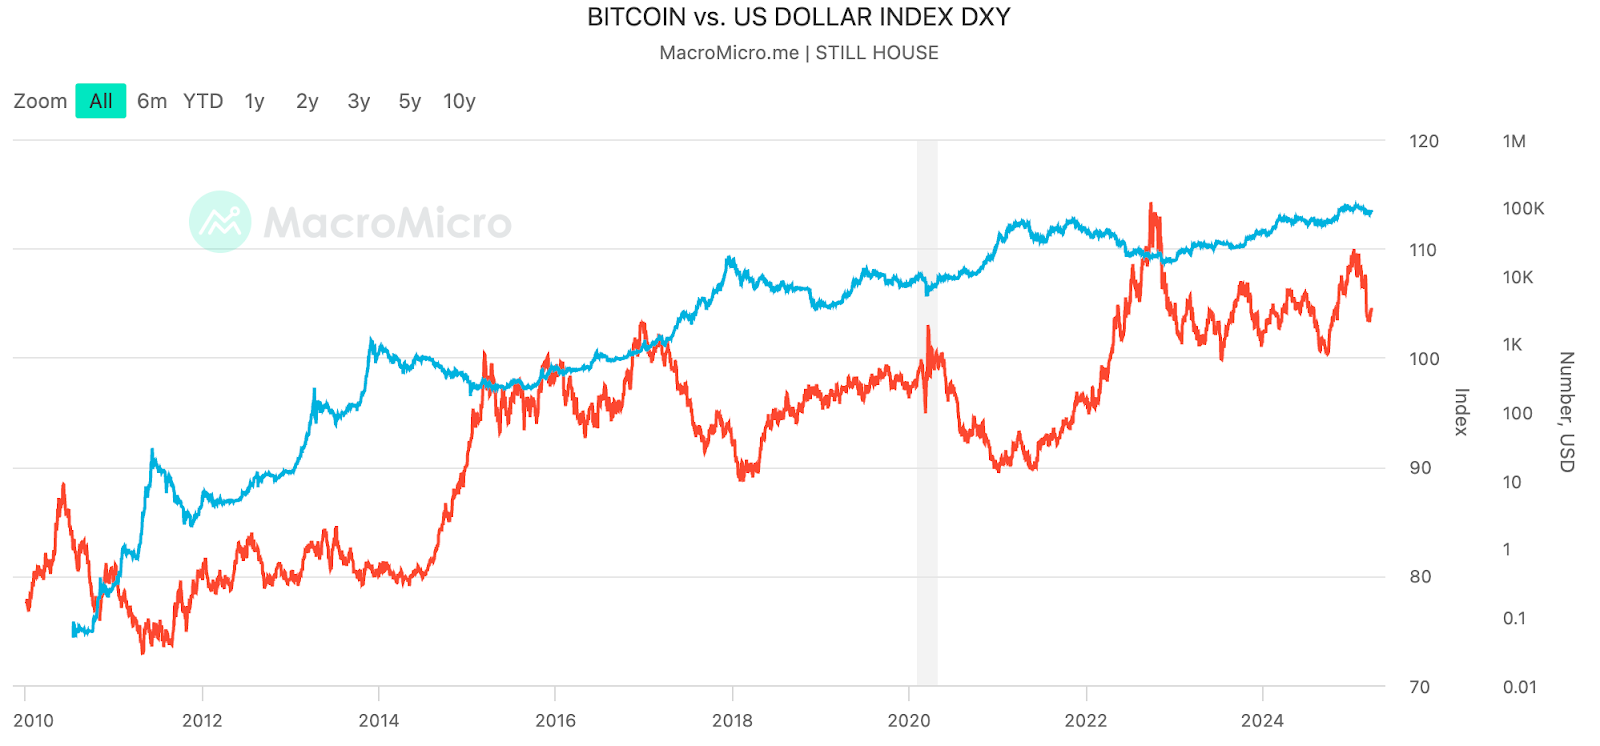
When the Dollar Index rises, it means the dollar is strengthening. In this case, funds may tend to invest in the dollar and other relatively stable assets, reducing demand for high-risk assets (like Bitcoin); market liquidity may tighten, risk appetite may decline, causing pressure on the crypto market, and prices may fall.
When the Dollar Index falls, indicating a weakening dollar, investors may seek other assets as a store of value, with Bitcoin sometimes viewed as “digital gold”; funds flowing out of the dollar market, partly turning to the crypto market, may drive crypto market prices up.
US Dollar Index and Bitcoin Price
(Source: MacroMicro)
Market sentiment and safe-haven demand: the Dollar Index also indirectly reflects global economic and political uncertainties. When risk-aversion sentiment rises, although the dollar is typically favored, some investors may also view Bitcoin as another safe-haven asset, so the relationship between the two is not absolute and needs to be considered alongside other macro factors.
3. Relevant Websites
- Bloomberg and Reuters: Provide real-time Dollar Index data and detailed interpretation.
- TradingView: Real-time charts and technical analysis tools for convenient observation of DXY trends.
- Investing.com: Provides real-time data, historical charts, and related news interpretations for the Dollar Index.
- FRED (Federal Reserve Economic Data): Although mainly providing macroeconomic data, it also offers historical trend data for the Dollar Index.
US STOCK MARKET
1. Composition of the US Stock Market
Main Markets:
- New York Stock Exchange (NYSE): Home to traditional blue-chip stocks and large established companies.
- NASDAQ: Dominated by tech stocks and high-growth enterprises such as Apple, Amazon, Google, etc.
Important Indices:
- S&P 500: Covers 500 large companies, representing overall market performance.
- Dow Jones Industrial Average: Tracks 30 representative blue-chip companies.
- NASDAQ Composite: Reflects the overall performance of technology and growth companies.
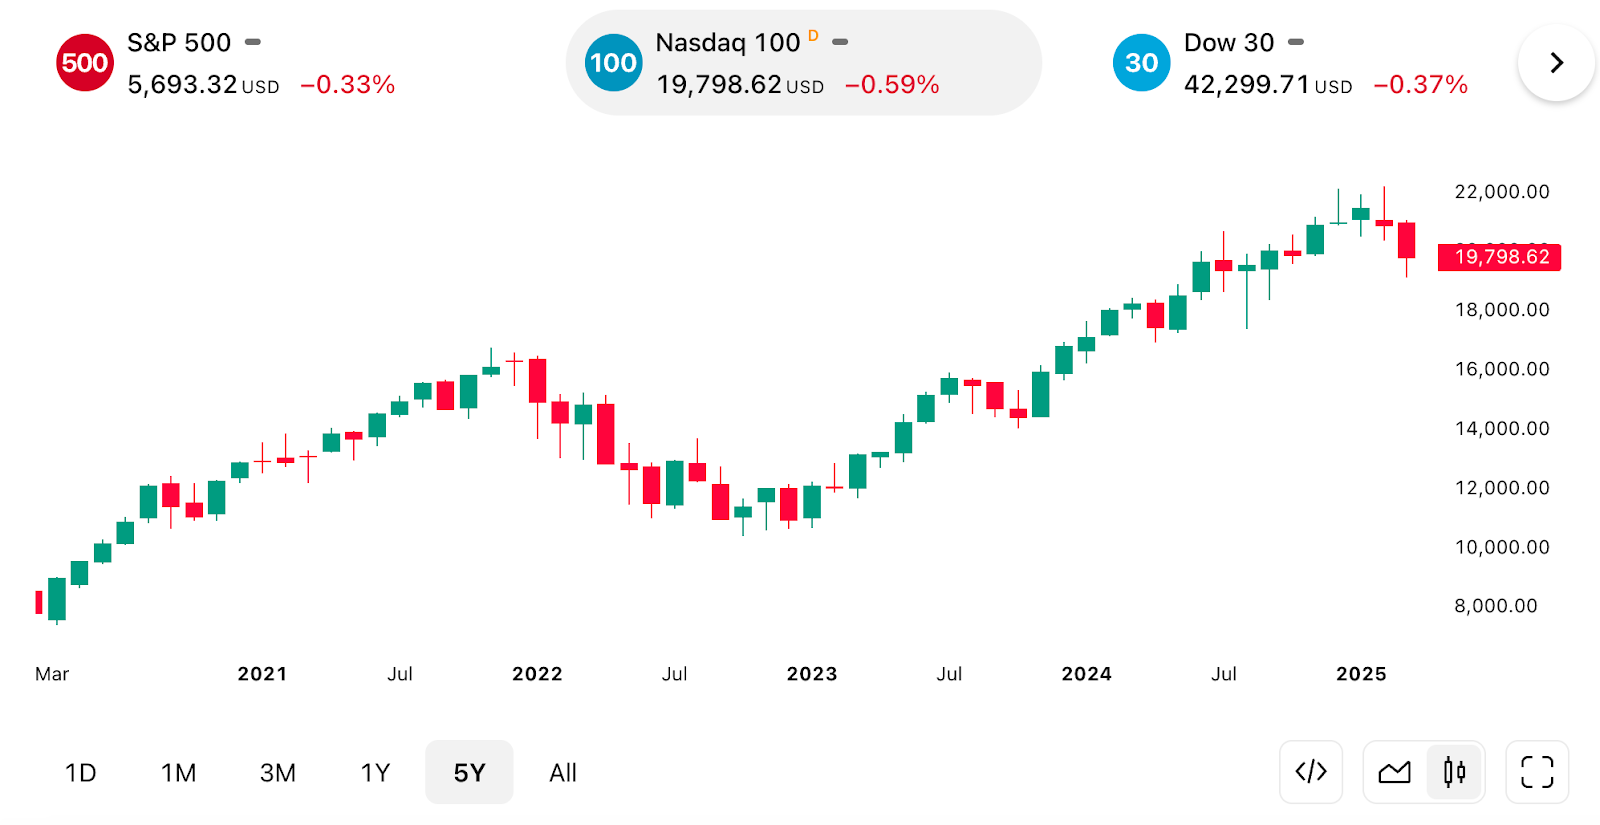
US NASDAQ Trend
(Source: TradingView)
Industry Sectors: Including technology, finance, healthcare, industrial, consumer goods, and other sectors, each with varying degrees of influence on the overall market.
2. Logic Behind US Stock Market Movements
US stock market movements are typically influenced by multiple factors, including:
Economic Data: Economic indicators (such as GDP, employment data, consumer confidence index, etc.) reflect economic health, directly impacting corporate earnings expectations and thus stock prices.
Corporate Earnings: Quarterly or annual financial reports reflect corporate profitability. Better-than-expected earnings often drive stock prices up, while poor performance may trigger sell-offs.
Monetary Policy: The Fed’s interest rate decisions and quantitative easing or tightening policies directly affect market liquidity and borrowing costs, thus influencing stock market performance. Rate hikes often suppress the stock market, while rate cuts can boost it.
Market Sentiment and Risk Appetite: Investor sentiment, market expectations, and global political-economic events (such as geopolitics, trade wars, etc.) will cause the market to enter states of “risk appetite” or “risk aversion,” affecting US stock movements.
Technical Factors: Technical indicators (such as moving averages, trading volume, RSI, etc.) also serve as references for short-term trading. Technical analysis is commonly used to determine buying and selling opportunities in short-term market fluctuations.
3. How Does the US Stock Market Affect Crypto Market Movements?
Liquidity and Risk Appetite: As an important component of global capital markets, US stock performance often affects overall risk appetite. When US stocks rise, the market is in a risk-seeking state, and investors may allocate more to high-risk assets (including Bitcoin); when US stocks fall significantly, risk aversion strengthens, funds may flow toward the dollar, bonds, or gold, leading to outflows from the crypto market.
Monetary Policy Linkage: Fed monetary policy affects both US stocks and the crypto market through the global liquidity environment. Tightening policies (rate hikes/QT) may cause liquidity to contract, which is unfavorable for crypto; conversely, accommodative policies (rate cuts/QE) help drive up high-risk assets like Bitcoin.
Global Market Linkage: US stock fluctuations are usually accompanied by changes in global market risk sentiment. Investors may choose to exit when the global risk environment deteriorates, and the crypto market, as a relatively high-risk asset, is also affected.
Overall, the influence of the three major indices on the crypto market is NASDAQ > S&P 500 > Dow Jones. Short-term Bitcoin trends are more influenced by NASDAQ, especially the capital flow direction of tech stocks. Long-term Bitcoin trends are more correlated with the S&P 500 because it reflects overall market liquidity and institutional investor behavior.
4. Relevant Websites
Financial Information Platforms:
- Bloomberg, Reuters: Provide real-time news, data, and in-depth analysis.
- Yahoo Finance: Free access to major indices, individual stock quotes, and financial report data.
- CNBC: Provides US stock news, real-time quotes, and video reports.
Trading and Chart Analysis Platforms:
- TradingView: Real-time charts, technical indicators, and custom analysis tools, supporting various markets and asset classes.
- Investing.com: Provides real-time data and charts for global stock markets, indices, commodities, forex, etc.
Official Data Sources:
- US Securities and Exchange Commission (SEC): Learn about corporate financial reports and market regulatory dynamics.
- US Bureau of Labor Statistics (BLS): Obtain employment and economic data.
These macroeconomic and financial market indicators provide crypto investors with references for judging overall market liquidity, risk appetite, and economic health. By focusing on these data, investors can better grasp the performance of Bitcoin and other cryptocurrencies in different market environments and formulate corresponding investment strategies.
For example, in environments with high interest rates, strong dollar, and relatively high Treasury yields, one might need to be more cautious about Bitcoin investments, while in accommodative, low interest rate, and rising risk aversion environments, it might be a good opportunity to position in Bitcoin.
▶ Buy Crypto at Bitget
CoinRank x Bitget – Sign up & Trade to get $20!


