


KEYTAKEAWAYS
- Trump currently leads Biden in polls and swing states. Key dates include party conventions in July/August, second debate in September, and election day in November.
- Major policy differences between candidates include taxes, immigration, and energy. Trump's policies may resist inflation decline more than Biden's.
- Historical election year trends show increased market volatility. A potential "Trump Trade" could impact bonds, stocks, gold, and cryptocurrencies.
CONTENT
Overview of the 2024 US presidential election, comparing Trump and Biden’s policies and potential market impacts. Analyzes historical election year trends and predicts possible “Trump Trade” scenarios.
ELECTION OVERVIEW
On June 28th Taiwan time, Biden and Trump held their first debate for the 2024 election. Trump performed significantly better, while Biden’s poor performance raised widespread concerns among the public about whether his advanced age and mental state could handle the job. After the debate, Trump’s approval rating rose sharply. At the same time, Trump has an overwhelming advantage in swing states, leading in all seven major swing states (North Carolina, Arizona, Georgia, Nevada, Wisconsin, Michigan, and Pennsylvania).
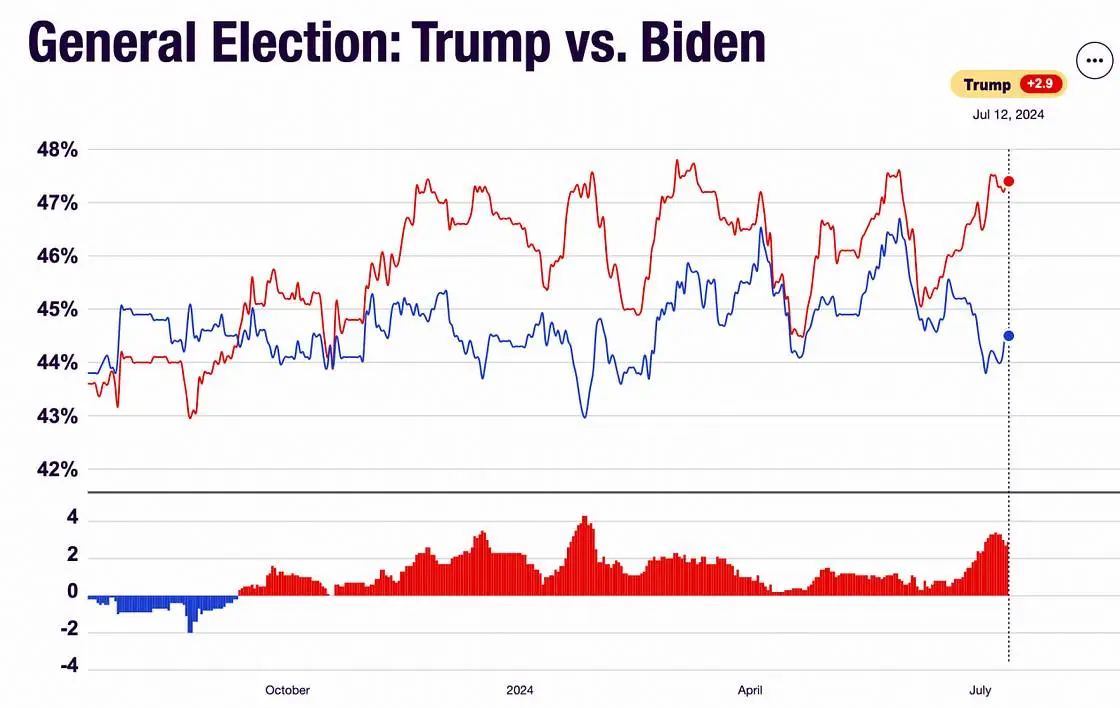
(Source: RealClearPolling)
There are three key time points for the future campaign:
- National Party Conventions: July 15-18, 2024, Republican National Convention; August 19-22, 2024, Democratic National Convention. Both parties will select their respective party’s presidential and vice-presidential candidates
- Second Candidate Debate: September 10, 2024
- Election Day: November 5, 2024
MAJOR POLICY DIFFERENCES
Trump and Biden have relatively consistent positions on infrastructure, trade, foreign policy, expanding investment spending, and encouraging manufacturing to return. The two have significant policy differences on fiscal and taxation, immigration, and new energy industries.
1) Fiscal and Taxation
Trump advocates continuing to reduce corporate income tax from 21% to 15% and does not advocate directly increasing fiscal spending. Biden’s “Balancing Act” proposes raising tax rates on corporations and the wealthy class, increasing the corporate tax rate to 28%, while continuing to reduce student loan debt. During his last term, Trump’s tax cut policy boosted U.S. stock earnings and promoted the return of overseas funds. The tax cut proposed in this round of campaigning is weaker than before (the previous tax reform adjusted the rate from 35% to 21%), and the boosting effect is also relatively weaker than before. CICC estimates that the net profit growth rate of the S&P 500 index in 2025 can be increased from the market consensus expectation of 13.7% by 3.4 percentage points to 17%.
2) Immigration
Since Biden’s inauguration in 2021, there has been a significant increase in illegal immigrants in the United States. Compared to Biden’s moderate immigration policy, Trump advocates continuing to tighten immigration policies but relatively relaxing requirements for “high-level” talents. The tightening of immigration policies may weaken the momentum of U.S. economic growth and push for re-acceleration of wage growth.
3) Industrial Policy
The two have significant differences in areas such as energy. Trump advocates returning to traditional energy, accelerating the issuance of oil and natural gas exploration permits, increasing the development of traditional fossil energy, etc., to ensure the United States’ cost leadership in energy and electricity. He may also cancel green subsidies for new energy vehicles and batteries. Biden advocates continuing to promote the development of clean energy.
4) Trade Policy
Both Biden and Trump implement high tariff policies, which may push up the cost of imported raw materials and commodity prices in the United States, thereby forming resistance to CPI decline. Compared to the two, Trump’s policy is more radical. Biden announced in May to increase tariffs on imported goods from China, but Biden’s increase only covers $18 billion worth of goods, and some increases will not be implemented until 2026. Trump said he would impose a 10% baseline tariff on goods entering the United States, while imposing an additional 60% or higher tariff on China, and would impose “specific taxes” on certain regions or industries.
It can be seen that Trump’s tariff policy, domestic tax cuts, and immigration policy are not conducive to the decline of inflation.
GENERAL CHARACTERISTICS OF ASSET PRICES IN ELECTION YEARS
First, from an annual perspective, the overall market performance in the election year and the magnitude of changes in the federal funds rate are not significantly different from other years.
Looking at quarters and months, in the early stages of the election (mainly referring to the third quarter of the election year), the magnitude of changes in the federal funds rate is significantly smaller than in other quarters, while asset prices show higher volatility during this period. The reason behind this may be that monetary policy tends to remain unchanged as the election approaches to avoid suspicion, while asset prices fluctuate due to the uncertainty of the election results. Contrary to the often strong seasonal pattern in October-December of non-election years, stock prices perform significantly weaker in October before the election than in non-election years.
REVIEW OF MARKET SITUATION AFTER TRUMP’S LAST ELECTION
On November 9, 2016, preliminary results of the U.S. presidential election were announced, with Republican presidential candidate Donald Trump winning the election and becoming the 45th President of the United States. At that time, Trump’s victory exceeded market expectations and triggered asset price fluctuations. The market bet on “Trump Trade”, showing high U.S. bond yields, strong U.S. dollar, and strong U.S. stocks in November-December 2016. After expectations were digested, the trade weakened. The following are the price changes of various assets at that time (all weekly charts).
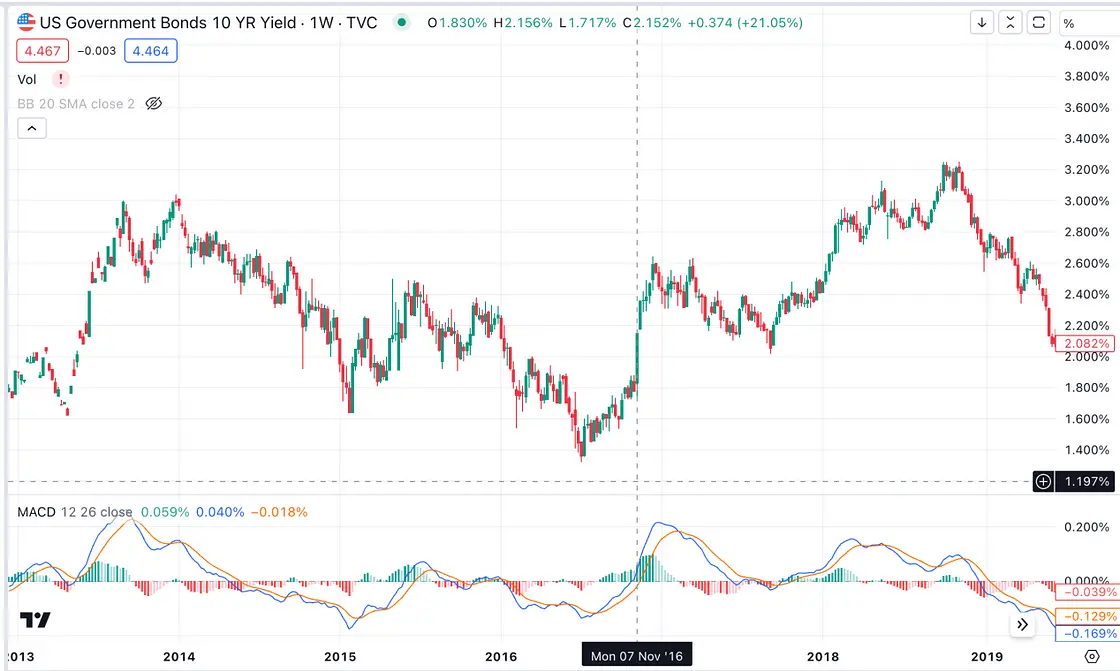
(U.S. bond yields rose and then fell. Source: TradingView)
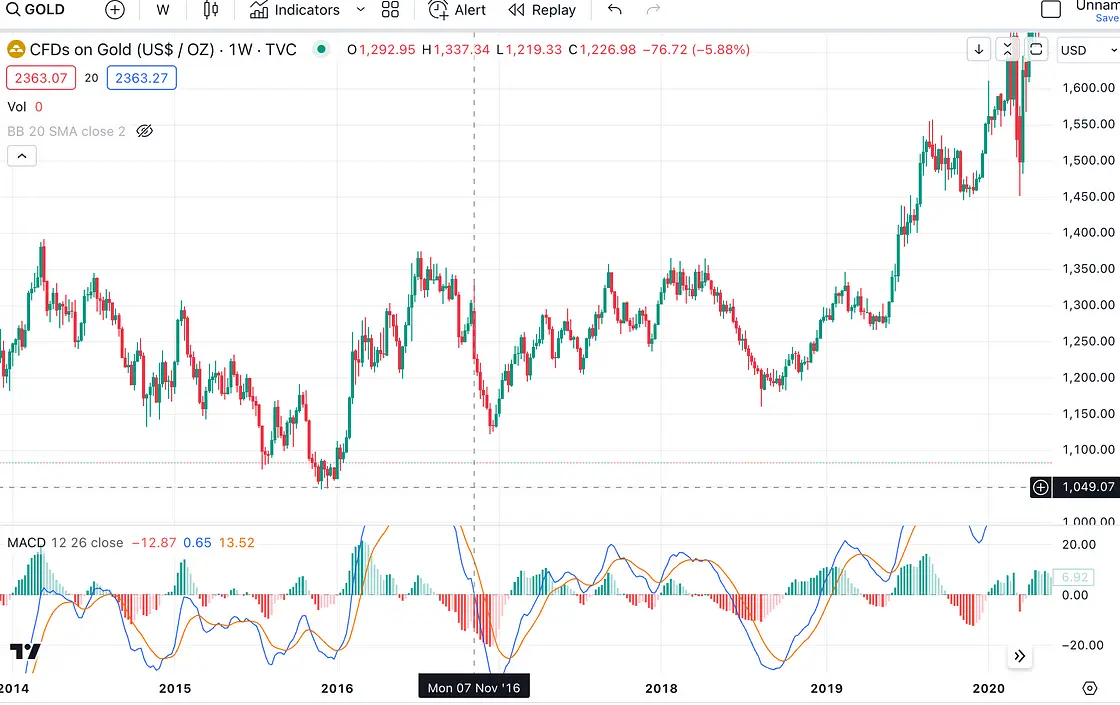
(Corresponding to the volatility of U.S. bond yields, gold first fell and then rose. Source: TradingView)
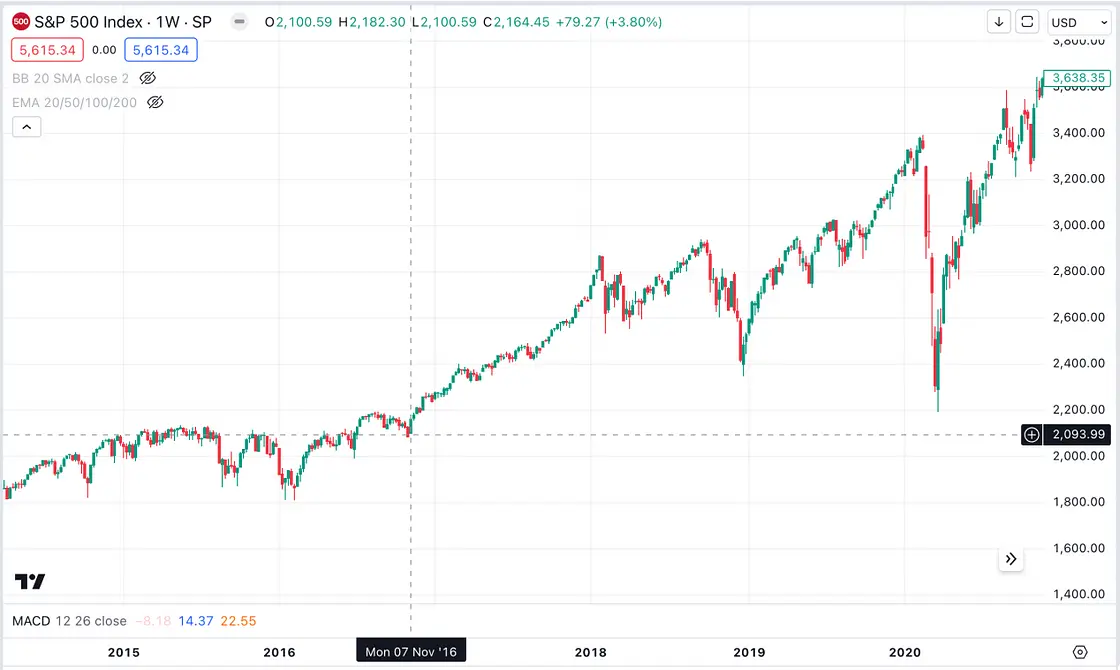
(S&P 500 rose. Source: TradingView)
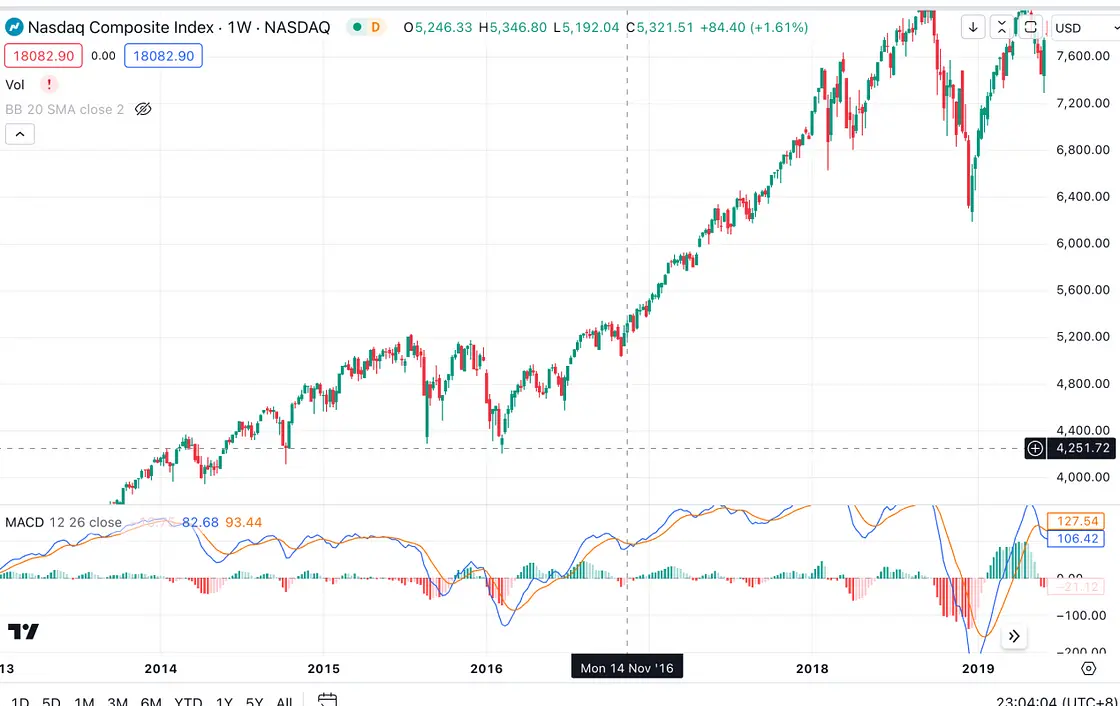
(Nasdaq rose. Source: TradingView)
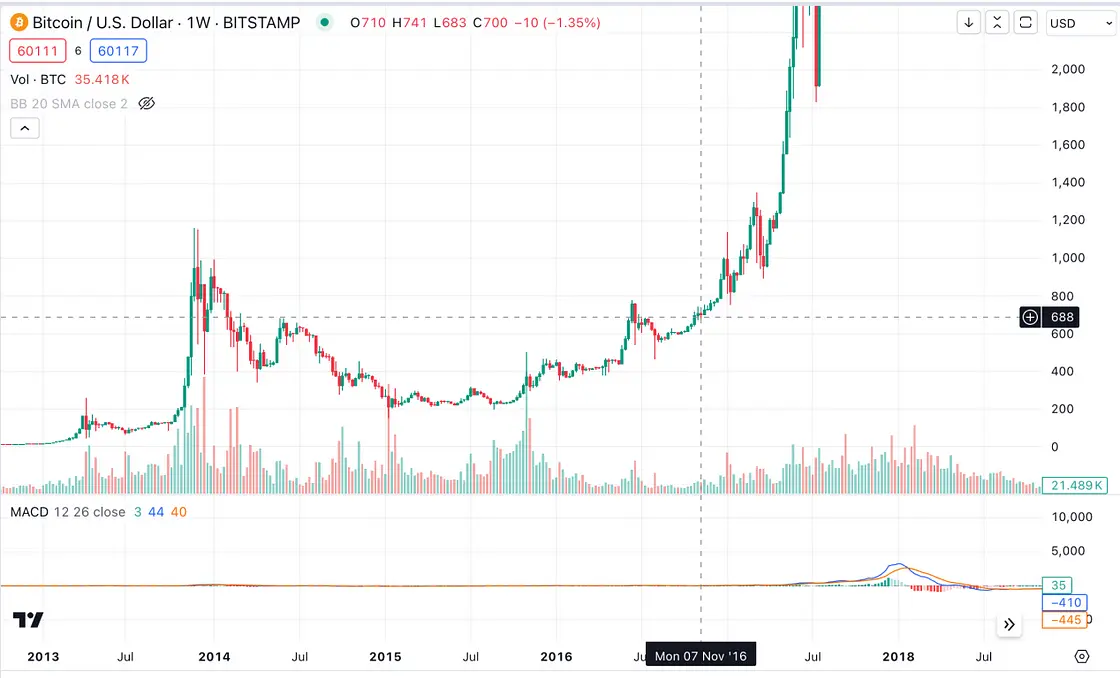
(BTC rose. Source: TradingView)
The start of this round of “Trump Trade” was greatly advanced. After the first candidate debate, the market’s expectation of Trump’s victory increased significantly, and the market began to layout “Trump Trade” in advance. The 10-year U.S. Treasury yield rose to near 4.5% on the second day of the debate.
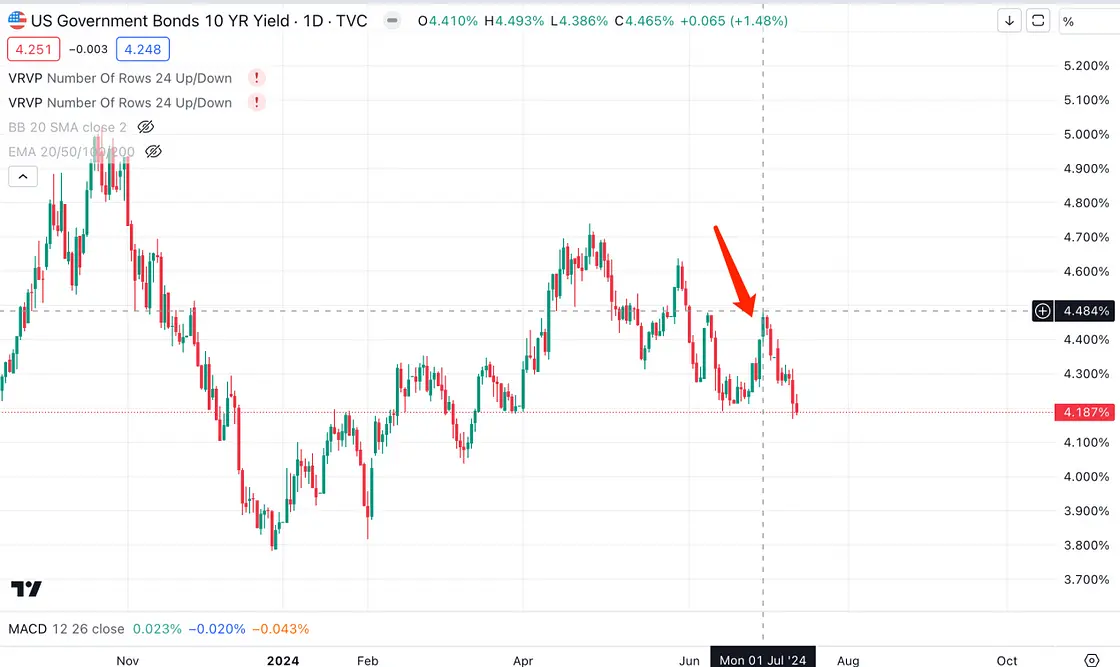
(Source: TradingView)
Coupled with the additional votes that the July 14 shooting incident involving Trump may bring him, the most likely outcome is that Trump will be elected president and the Republican Party will control both the House and Senate. It can be predicted that the weekend shooting incident involving Trump will bring a rising market for U.S. stocks on the coming Monday.
SUMMARY
The impact of the U.S. election on the market:
- The election itself cannot be used as a reason for bullish trading. The simple logic that the Democratic Party needs the U.S. stock market to keep rising in order to win the election does not hold.
- In a regular election year, there is a downside risk around October due to increased volatility.
- Trading the election result (Trump Trade) mainly involves long CPI, long U.S. bond yields (here “long” is relative to the market’s downward expectation, meaning resistance to the decline of CPI and U.S. bond yields rather than absolute rise), short gold, long U.S. stocks but not as strongly as when Trump was elected last time; long BTC (believing that BTC follows U.S. stocks more, and the divergence from U.S. stocks is not sustainable in the long term & Trump is crypto-friendly).