KEYTAKEAWAYS
-
U.S. GDP Growth Slowdown: The U.S. GDP grew at an annualized rate of 1.6% in Q1 2024, below expectations, reflecting weakened consumer spending.
-
Fed's Interest Rate Stance: Fed officials advocate maintaining high interest rates due to unsatisfactory inflation progress, delaying potential rate cuts.
-
Inflation and Job Market: Inflation shows signs of easing, especially in goods, but service sector inflation remains challenging. The job market is cooling, but recession indicators are not yet triggered.

CONTENT
Through this in-depth report, readers can explore the global macroeconomic changes in the first half of 2024, focusing on GDP, interest rates, Fed meeting minutes, unemployment, and inflation, and their impact on different assets with CoinRank.
INTRODUCTION
As we reach July 2024, the investment market is gradually recovering from the shadow of aggressive interest rate hikes. Looking back at the first half of 2024, what are the most crucial information or issues that investors should focus on? Today, we’ll examine the global macroeconomic changes in the first half of 2024, analyzing GDP, interest rates, Federal Reserve meeting minutes, unemployment rates, and inflation to piece together the overall economic picture and its impact on different assets.
GDP
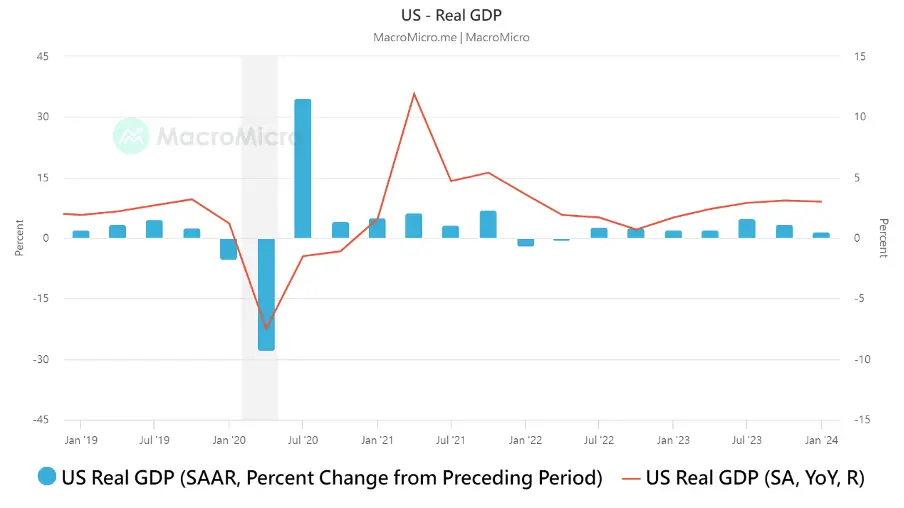
(Source: MacroMicro)
The latest U.S. economic growth report shows that growth slowed in the first quarter, with GDP growing at an annualized rate of only 1.6%, below expectations. The Federal Reserve’s high interest rate policy is considered one of the factors contributing to weakened consumer spending and overall economic momentum. Another piece of concerning news is that the core personal consumption expenditures price index growth rate reached 3.7%, exceeding expectations.
This performance is even worse than Bloomberg economists’ prediction that first-quarter GDP might fall to 2.5%, indicating that U.S. economic growth is not as robust as we had imagined (though not poor enough to signal a recession).
Looking at market reactions, the 10-year U.S. Treasury yield closed at a recent high of 4.72, suggesting that investors are more concerned about the higher-than-expected PCE data rather than the possibility of recession brought by the GDP decline. It appears that market participants are not overly worried about a U.S. economic recession; at least the Treasury bond reaction shows no indication of imminent rate cuts.
However, the higher-than-expected PCE will only make it more challenging for the Federal Reserve to act. Should they raise rates to suppress the economy, or cut rates and risk inflation resurging? These data underscore the importance of the Fed’s future policy guidance. Let’s continue to monitor the Fed’s interest rate policy and keep an eye on its further moves.
INTEREST RATE
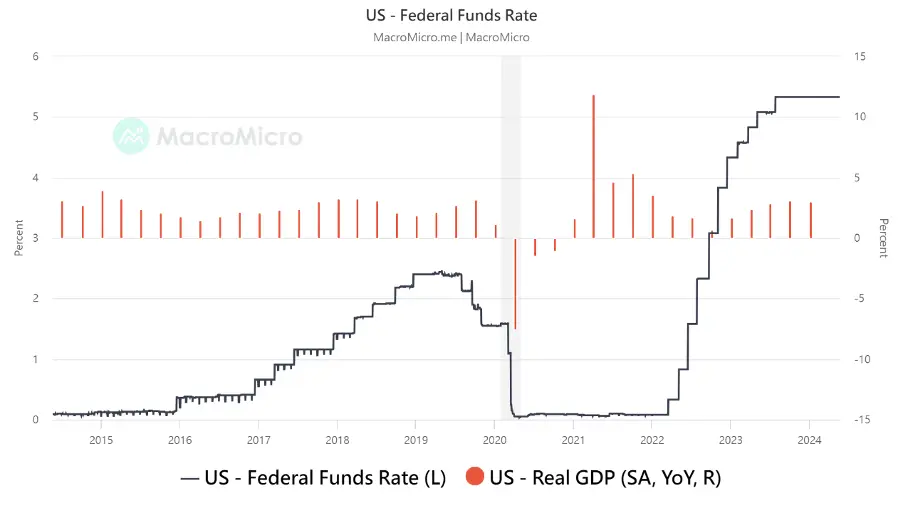
(Source: MacroMicro)
Next, we can observe Federal Reserve officials’ attitudes towards interest rate positioning. According to the latest comments from Fed officials, they suggest maintaining higher interest rates for a longer period to wait for more evidence of inflation easing, and are not in a hurry to cut rates.
- Cleveland Fed President Mester: At an event in Wooster, Ohio, she stated that price growth will slow down more gradually than last year due to reduced downward pressure from supply chain improvements. She believes it will take longer to achieve the 2% inflation target. She will step down at the end of June and has FOMC voting rights this year.
- New York Fed President Williams: In a Reuters interview, he said there is no reason to adjust monetary policy now, and there is no clear confidence in a significant inflation decline in the short term.
- Richmond Fed President Barkin: In a CNBC interview, he stated that demand needs to cool further to bring price growth to target, pointing out that supply chain improvements have already reduced goods inflation. He is a 2024 FOMC voting member.
- Atlanta Fed President Bostic: Expressed gratitude for the cooling in the latest CPI report but will watch future data to ensure the trend doesn’t reverse. If inflation slows gradually, rates could be lowered before year-end.
Overall, officials believe that despite improvements in the latest data, more data is needed to be confident that inflation is moving towards the 2% target, so maintaining high interest rates for a longer period is necessary. In simple terms, Fed officials will not consider “one good piece of data” to offset “three bad pieces of data” from the past. They still need more evidence to prove that inflation is slowing down, indicating that they are not in a hurry to cut rates.
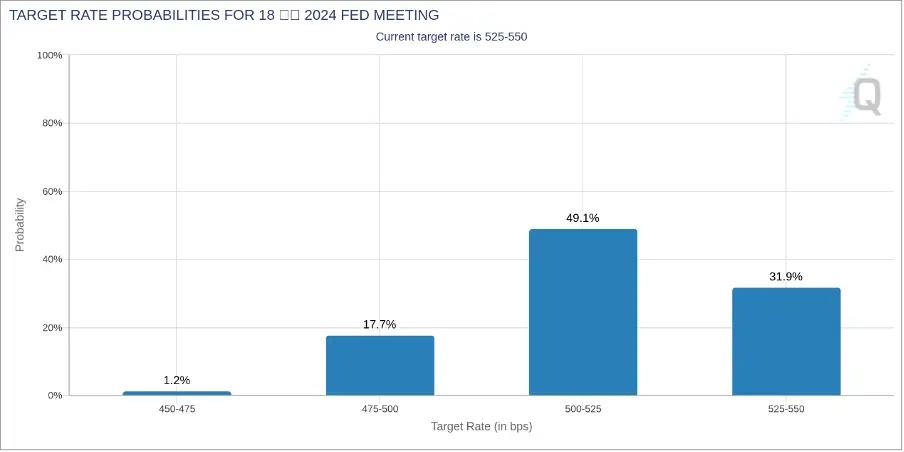
(Source: FedWatch)
From the chart above, we can see that market expectations for a rate cut in September have again approached the 50% level, with talks of two rate cuts in 2024 returning to the stage. Gold, bonds, and U.S. stocks, all sensitive to interest rates, have started to rebound. Now, San Francisco Federal Reserve Bank President Mary Daly has also stated that “interest rates are suppressing the economy,” but “more time” is needed to bring inflation back to the target level.
FED MEETING SUMMARY
After reviewing official statements, we can continue to examine the Fed meeting minutes to confirm whether the officials’ statements align with the meeting records. The Fed recently released relevant records, and here are the key points from the Federal Open Market Committee (FOMC) meeting minutes summarized by the author:
- Although inflation has eased over the past year, progress in cooling inflation in recent months has not been satisfactory, and inflation remains high. Committee members remain highly attentive to inflation risks.
- The committee believes that it may take longer than previously expected for inflation to sustainably return to the 2% target. They discussed several factors favorable to inflation decline, such as slowing housing services price inflation and labor market supply and demand gradually balancing.
- Economic activity continues to expand at a solid pace, and labor market conditions remain tight. However, the committee generally expects GDP growth to slow this year compared to last year.
- Considering disappointing inflation data and strong economic growth momentum, the committee decided to maintain the federal funds rate target range at 5.25% – 5.5%.
- Most members believed that it would not be appropriate to cut rates before gaining confidence in inflation’s sustainable return to 2%. Future policy paths will depend on economic data, outlook evolution, and risk balance.
- The committee decided to slow the pace of balance sheet reduction starting in June, reducing the monthly cap on Treasury securities redemptions from $60 billion to $25 billion. However, they emphasized that this does not imply a change in monetary policy stance.
Through these meeting minutes, the FOMC conveys to the market that although the economy maintains expansion, the inflation problem is not yet solved, conditions for rate cuts are not mature, and monetary policy will maintain a tight stance. Future policy direction will be data-dependent, and vigilance towards inflation risks will be maintained. The adjustment in the pace of balance sheet reduction does not represent a policy shift.
Overall, the FOMC is trying to guide market expectations for the policy path, avoiding market speculation about near-term rate cuts. Officials are quite cautious in their attitudes, with various state central bank presidents emphasizing the need for “several months” of good inflation data before rate cuts are possible.
UNEMPLOYMENT RATE
(Source: MacroMicro)
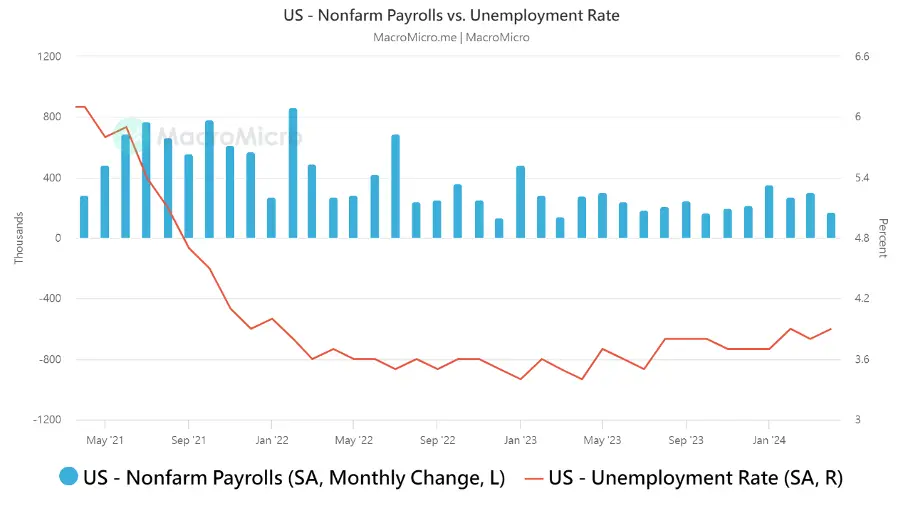
The U.S. April nonfarm payroll additions were far below expectations, the unemployment rate rose, and wage growth slowed, indicating that the job market is cooling after strong growth at the beginning of the year, and inflation is likely to continue declining. This is good news for the Fed, but more such messages are needed to drive rate cut policies.
Specifically, data released by the Bureau of Labor Statistics (BLS) on Friday (3rd June) showed that last month’s nonfarm payroll additions were 175,000, far below the market expectation of 238,000, the smallest increase in 6 months. The previous value was significantly revised up from 303,000 to 314,000. The unemployment rate rose to 3.9%, higher than the market expectation and the previous value of 3.8%.
Notably, average hourly earnings increased by 3.9% year-over-year, slightly lower than the market expectation of 4.0%, and also below the previous value of 4.1%, the lowest growth rate since June 2021. On a monthly basis, it grew by 0.2%, also lower than the expected and previous value of 0.3%.
Market analysts point out that the latest nonfarm payroll data shows that the U.S. labor market is experiencing a certain degree of cooling after a strong start to the year. The report further indicates that demand for workers is slowing, showing that monetary policy is finally taking effect in the labor market after a long lag.
IS A RECESSION COMING? A BRIEF DISCUSSION OF THE SAHM INDICATOR
Here, the author would like to share a concept with readers. While discussing the recent unexpected unemployment rate and unemployment claims, many market investors have started using the “Sahm Index” to explain, believing that a recession is imminent and “implying that the data may surge upwards,” so the Fed should cut rates as soon as possible to prevent an economic recession.
However, in the author’s view, is the so-called Sahm indicator truly “predictive”? Today, we would like to delve deeper into the content of these indicators with you.
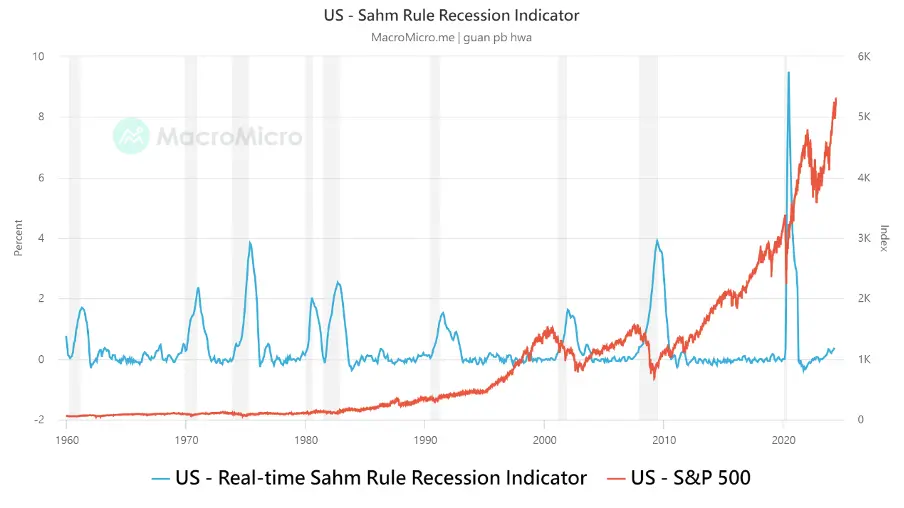
The so-called Sahm recession indicator was proposed by Claudia Sahm, an economist at the Federal Reserve System. Her basic concept is that “when the U.S. 3-month average unemployment rate exceeds the lowest unemployment rate of the previous year by 0.5%, it indicates that the economy is experiencing a recession.”
(Source: MacroMicro)
Recently, this indicator has been at 0.37, not yet triggering the recession threshold of 0.5. However, it should be noted that the indicator is indeed slowly rising, but still does not have academic “recession” significance.
The Sahm indicator is a tool used by economists to determine “whether the economy has already fallen into a recession.” It is used for “identification” rather than “prediction,” meaning that if you want to use the Sahm indicator to predict an economic recession, it’s more like when we see the Sahm indicator falling into recession, we are already in a recessionary environment.
Compared to the Sahm indicator, economists tend to use the OECD indicator or initial jobless claims as indicators to predict economic recession, as these reflect changes in various countries’ economic trends and involuntary unemployment.
(Source: MacroMicro)
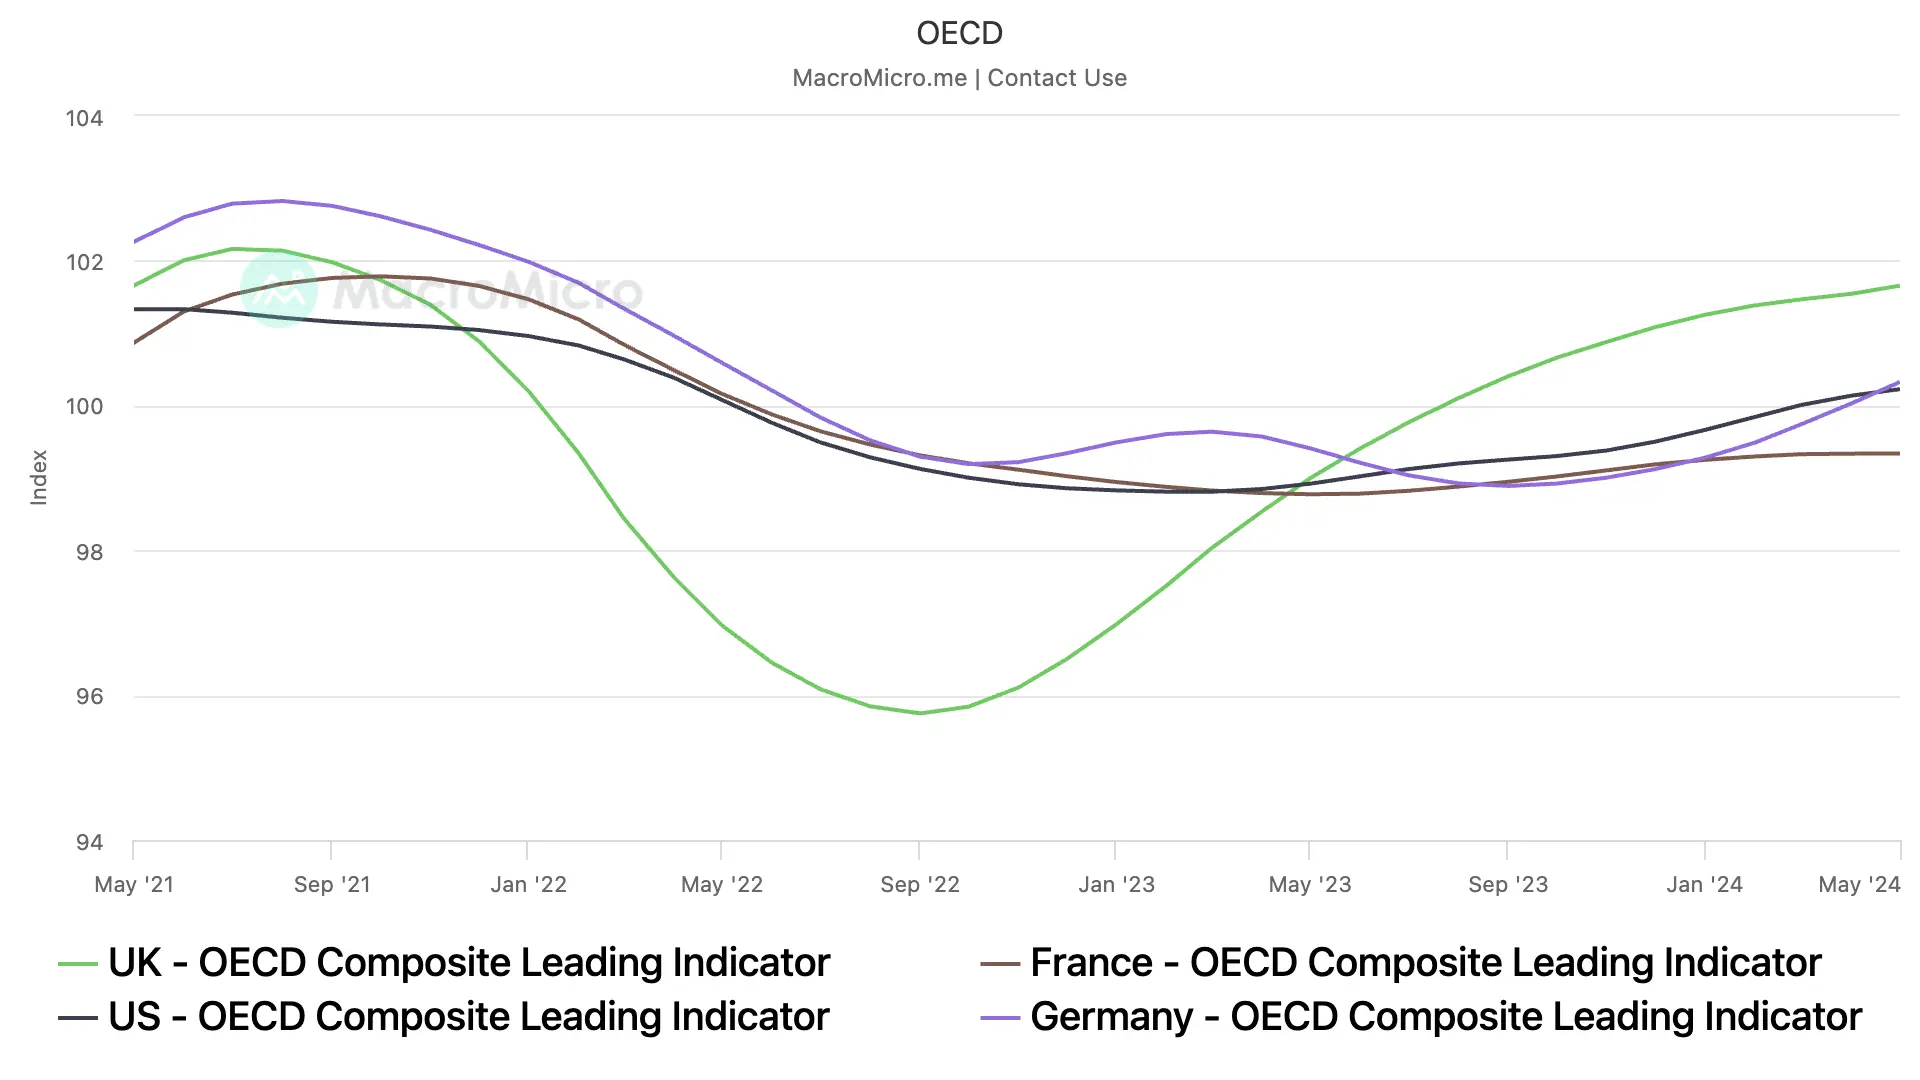
Among them, the OECD leading indicator is specifically designed to predict economic trends. The indicator uses 100 as the benchmark, with an upward indicator representing improving fundamentals, and a downward indicator representing overall deterioration of fundamentals.
Before each economic recession, this indicator would decline, but not every decline necessarily leads to an economic recession. Looking at the chart above, the OECD U.S. leading indicator for March 2024 is still rising, and indicators for European countries including the UK, Germany, and France are also rising, showing that the probability of the European and American economies entering a recession in the short term is still low.
Therefore, readers need not worry excessively, nor pay too much attention to others’ fears about economic recession in the market. We should still focus on interpreting the data content.
Taking a step back to look at unemployment claims, in the 20 years before the COVID-19 pandemic, the average number of U.S. applicants was about 345,000. Now it’s only about 230,000, which is higher than expected. Unless we see a rapid deterioration in the labor market, this is really not a sign of “recession” in the U.S. job market.
INFLATION (CPI)
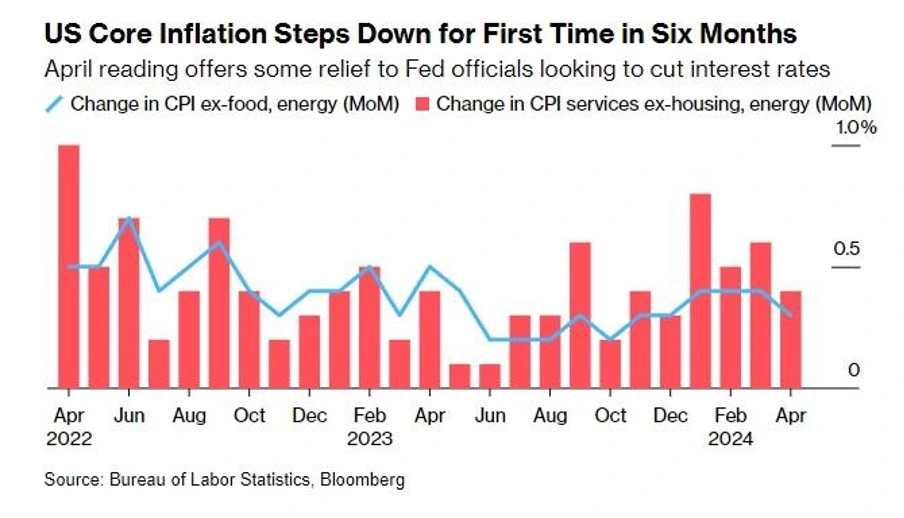
After three months of inflation data exceeding expectations, the U.S. core Consumer Price Index (CPI) in April finally showed its first decline in six months. Overall inflation still received positive contributions from energy (energy prices began to decline after late April, so there’s no need for excessive concern). Core goods maintained a negative contribution, which somewhat reassured Federal Reserve (Fed) officials who hope to start cutting interest rates this year.
The core CPI (excluding food and energy costs) rose 0.3% compared to March, ending three consecutive months of higher-than-expected data. This decline is seen as a sign that inflationary pressures are easing.
However, there’s always a “but.” The report shows that housing prices, which the Fed is concerned about, remain a significant problem. In April’s core CPI composition, housing prices, which account for nearly one-third of the weight, increased 0.4% month-over-month and 5.5% year-over-year. For the Fed trying to bring the inflation rate back to 2%, a 5% increase may still be too high. However, compared to the previous value (5.65%), we’ve seen rents starting to slow down, which could be viewed as a good sign.
Of course, the Fed never expected inflation to recede quickly. Remember what Powell said yesterday at an event in the Netherlands? “The path of inflation coming down is not going to be smooth. We need to be patient and let restrictive policy do its work.”
Looking closely at the internal changes in CPI data and providing some simple thoughts for reference, here’s a table of relevant CPI data month-over-month increases:

(Source: MacroMicro)
From the data, we can see that inflation in the food category is almost negligible, and this has been the case for several months.
The month-over-month increase in energy is 1.12%, which corresponds to the rise in oil prices in April. We can confirm that oil prices formed an upward high consolidation pattern from mid-March to mid-April. However, due to the high volatility of oil prices, readers need not pay excessive attention to this.
Looking at the details of goods inflation (CPI can be simply divided into goods inflation and services inflation), the month-over-month increase in apparel inflation is 1.2%, which is a new high in recent months. However, like oil, clothing prices are greatly affected by seasonality, especially with the Olympics coming soon, which may impact the volume of apparel consumption.
The biggest contributor to the decline in goods inflation this time (month-over-month increase of -0.1) comes from the -0.45% month-over-month increase in new car prices and the -1.38% month-over-month increase in used car prices. These two items have relatively high weights in goods inflation, and seeing such a decline is a relatively good result in the author’s opinion, showing no signs of a resurgence in goods inflation.
Next, let’s continue to look at the data for service-type inflation. First and foremost is housing inflation at 0.22%, which has decreased compared to last month (0.4%), indicating that the more stubborn housing and rental inflation have slightly declined.
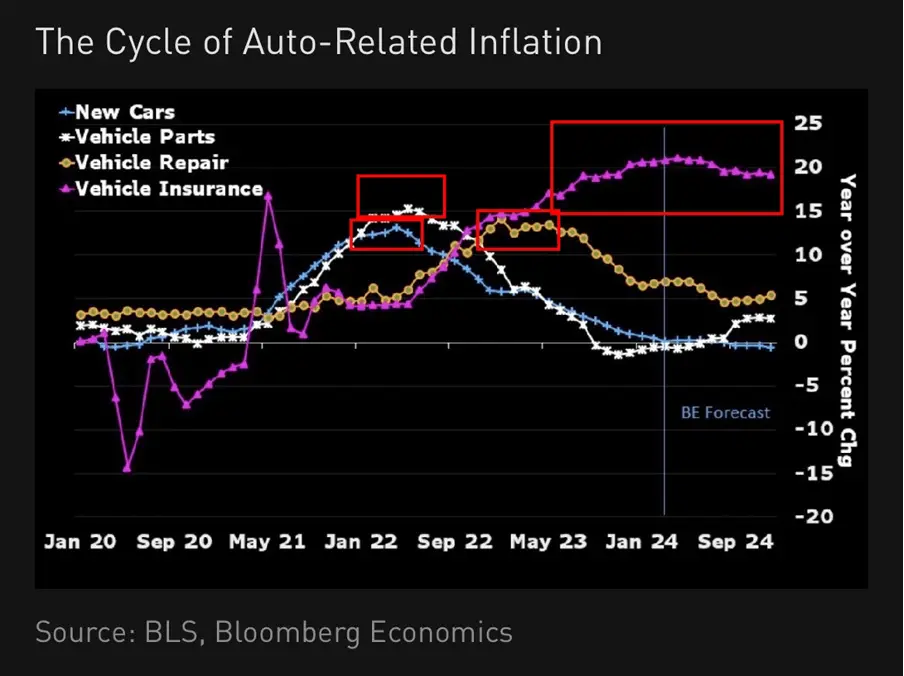
(Source: BLS)
Another important change is in transportation services. As transportation services account for a significant weight in CPI calculation (about 5-6%), the month-over-month increase has dropped to 0.86% this month compared to last month (1.52), which is an improvement.
The improvement in data comes from the highly lagging auto insurance, as shown in the chart above. Auto insurance is the data with the strongest lag and the latest to decline (2.6% last month, 1.8% this month).
If readers are interested in this area, they can refer to U.S. insurance companies and compare their recent financial reports to get a general understanding that auto insurance is likely to continue declining.
Lastly, regarding education and entertainment, the changes in both are still acceptable. Except for education being slightly higher, both have been fluctuating at low levels. For the Fed now, if rent and auto insurance can effectively decline, confidence in the slowdown of inflation is likely to gradually recover.
(Source: The Wall Street Journal)
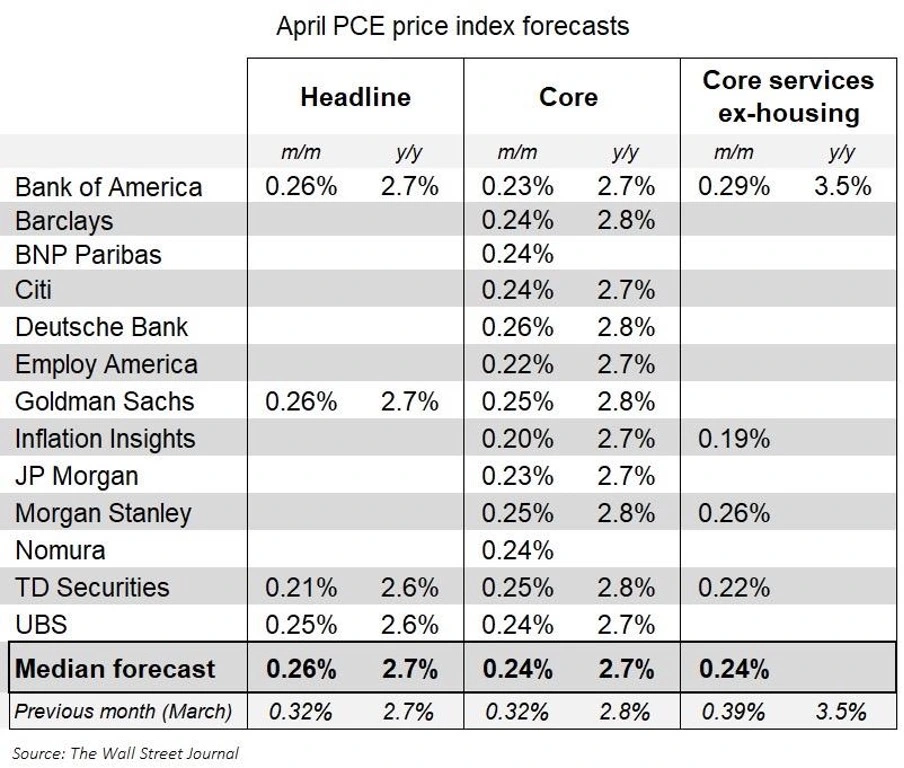
Next, let’s look at investment banks’ PCE expectations calculated from the released PPI and CPI data. Overall, these numbers are lower than the previous period, but given what we’ve seen in consumer and producer price inflation, these numbers may be benign.
The month-over-month increase in core PCE is expected to be around 0.24, which naturally shows a decline compared to the previous core PCE month-over-month increase of 0.31%. If we put together the pessimistic employment data (which isn’t really very pessimistic) and the slowing inflation, we seem to see again that the U.S. economy is in a good situation where “there’s no excessive concern about the economy or corporate earnings, and the slowing inflation is prompting the Fed to start cutting interest rates.”
INTEREST RATES ARE GRAVITY: CRYPTOCURRENCIES, STOCKS, BONDS
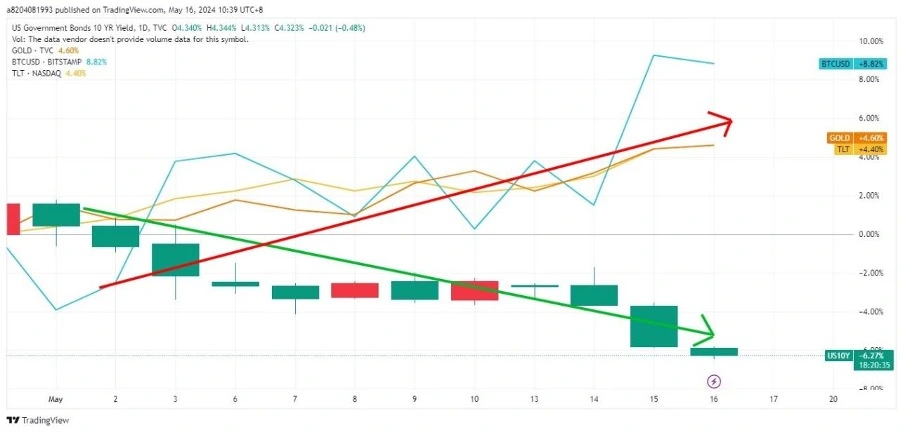
When the market received inflation data that met expectations, expectations for interest rate cuts increased, stimulating price increases in interest-sensitive precious metals and bonds. At the same time, U.S. stocks and Bitcoin also surged.
The author wants to share a concept with readers: when the macroeconomic environment enters an interest rate cutting cycle, risk assets and bonds often perform well. However, when the market worries about prolonged high-interest rate environments and sees a strengthening dollar, it often suppresses the performance of cryptocurrencies and stock markets.
CRYPTOCURRENCIES, STOCKS
The author wants to caution readers against overly anticipating the upcoming Bitcoin “halving” event. Although historically, Bitcoin halvings have potentially driven price increases, macroeconomic factors may have a more significant impact on Bitcoin.
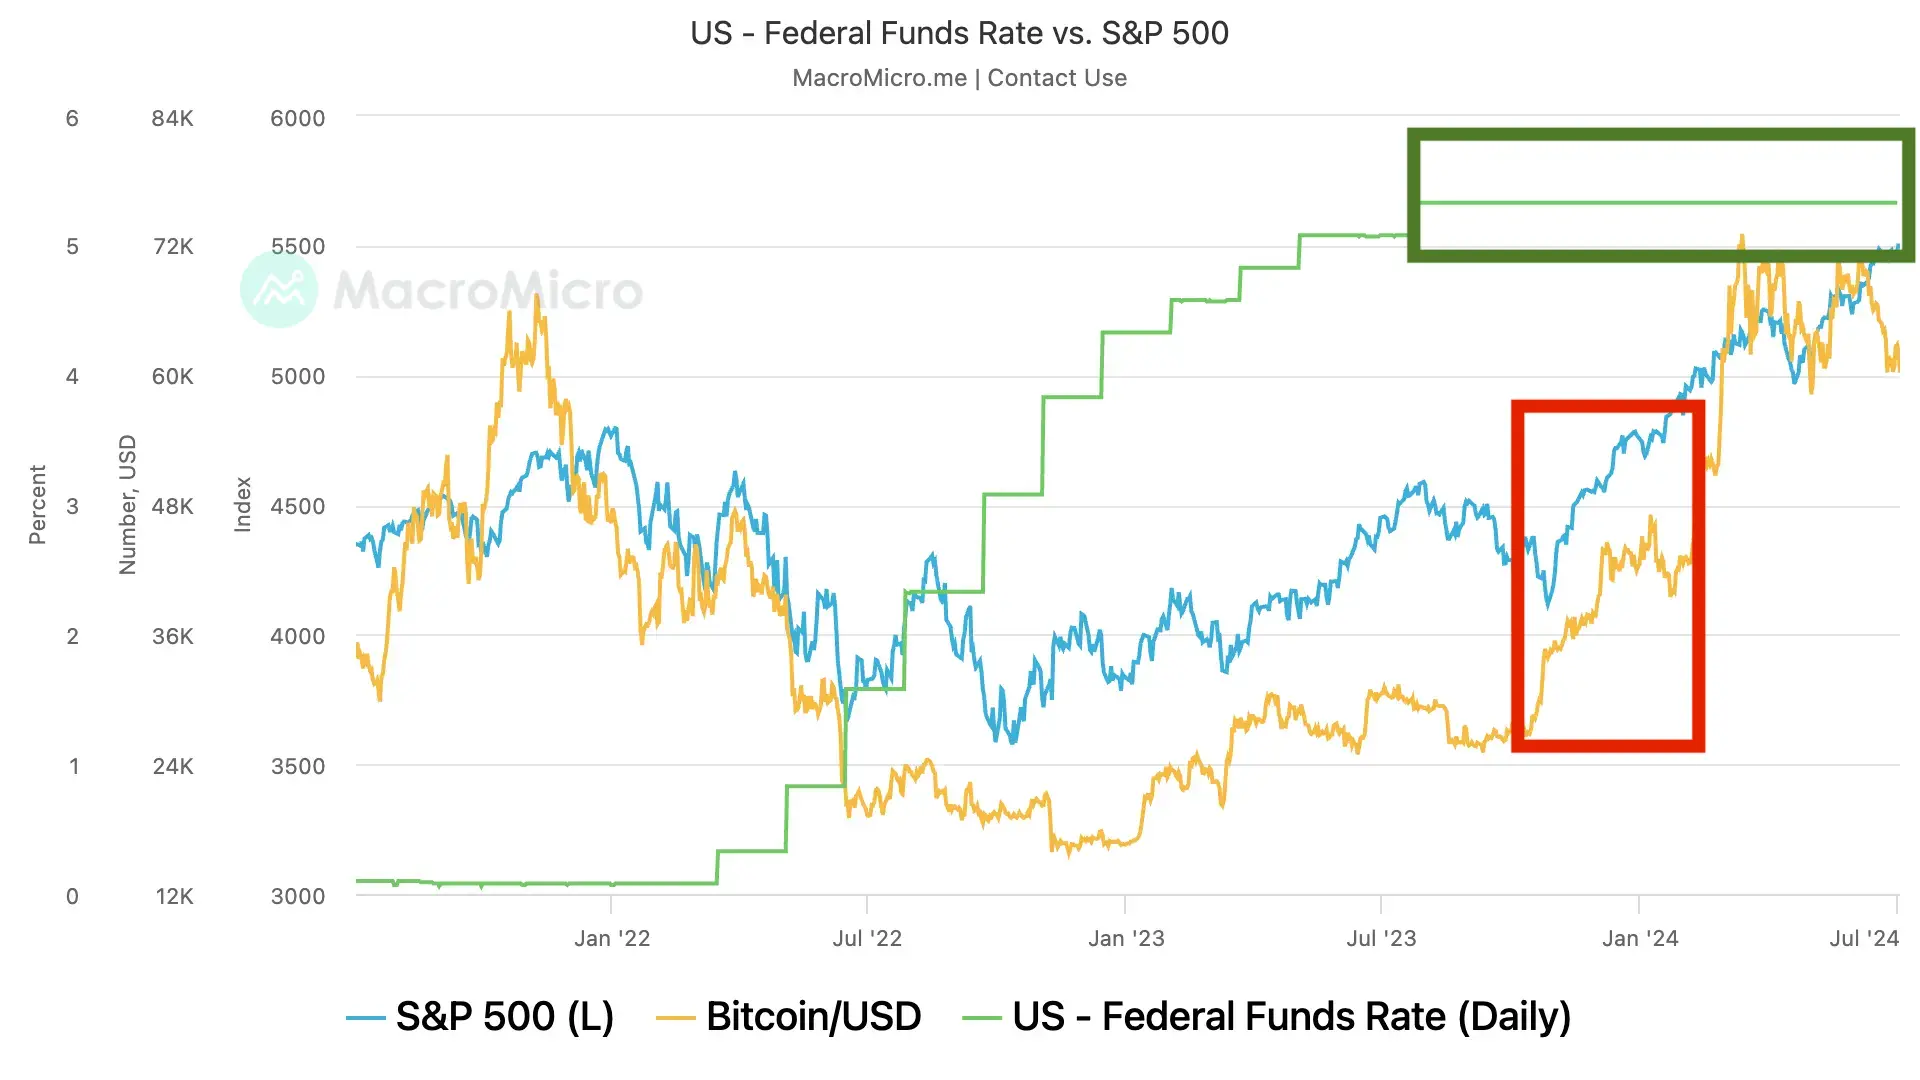
From the chart above, it’s clear that Bitcoin and U.S. stock trends are closely related to the Fed’s interest rate decisions. During this round of rate hikes, both experienced enormous pressure until interest rates entered a plateau (green box), after which Bitcoin and U.S. stocks successively started upward trends (red box).
Readers should be cautious: Bitcoin is often viewed as a safe-haven asset in the crypto world, but it doesn’t possess the safe-haven qualities of gold. On the contrary, it’s an ultra-high-risk asset. Strong U.S. economic performance and persistent inflationary pressures, causing the Fed to delay rate cuts, will increase pressure on investing in risk assets.
BONDS
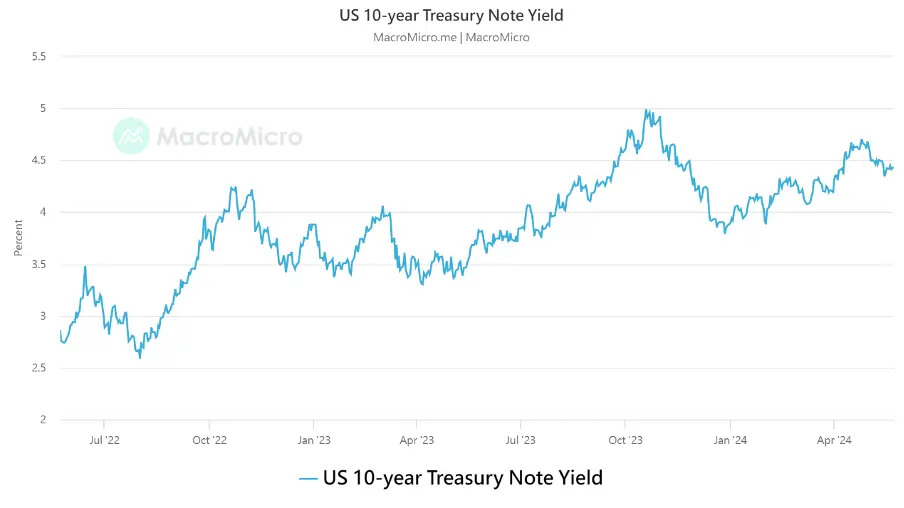
Honestly, although the previous U.S. inflation data looked chaotic, it tells us that the U.S. economy has been affected by higher U.S. Treasury yields, but the impact isn’t very significant.
Therefore, we can see from the chart above that U.S. Treasury yields haven’t crashed straight down but started to rebound after hitting the neckline.
The main reason for the Treasury rebound is related to Fed officials. As U.S. inflation hasn’t “slowed down beyond expectations” at this stage, Fed officials must maintain a certain hawkish stance. If Fed officials turn dovish too quickly and Treasury yields decline rapidly, we would inevitably see inflation heating up again in the future.
For example, the following statement from a Fed official perfectly illustrates this situation.
Fed’s third-in-command John Williams said he was pleased to see U.S. CPI cooling. Although we shouldn’t overemphasize the latest economic data, seeing April data cool down is indeed a positive development after disappointing data in the past few months, and the overall trend looks quite good, indicating that inflationary pressures are gradually easing.
However, Williams still pointed out that this good news isn’t enough for the Fed to cut rates soon. Officials still can’t be certain that price pressures will continue to move towards the 2% target. The current monetary policy is restrictive and in good condition, and he doesn’t see any indicators suggesting a reason to change the monetary policy stance.
In plain language, he tends to hold steady because the current U.S. interest rates can continue to suppress inflation. So his attitude is neither hawkish nor dovish, planning to quietly observe changes in U.S. inflation.
Looking ahead, as U.S. consumer demand decreases and international energy prices decline, I believe May inflation is likely to further moderate. However, before the official data is released and the Fed publishes a new interest rate path in June, the 10-year Treasury yield should consolidate between 4.4%-4.6%, waiting until June to see a new trend.
If the May inflation data released in June moderates as expected, it means the June FOMC meeting is likely to turn dovish. At that time, Treasury yields have a higher probability of breaking below the 4.4% lower bound of the range.
CONCLUSION
Overall, U.S. economic growth is slowing, but recession risk isn’t high. Signs of cooling inflation are gradually appearing, but it’s not an overnight process. The key variable now is the Fed’s interest rate policy. As long as inflation remains under control, interest rates are likely to reach a turning point in the second half of the year. Below, the author summarizes the key points for readers to reference in analyzing macroeconomic data for the first half of the year:
- U.S. economic growth is slowing, with first-quarter GDP growth rate at only 1.6% annualized. However, the market is more concerned about inflation than recession risk.
- Although U.S. inflation has eased recently, Fed officials believe more data support is needed, thus advocating maintaining high interest rates for some time and not rushing to cut rates.
- Fed meeting minutes show that despite continued economic expansion, inflation remains unresolved, and conditions for rate cuts are not yet mature. Future policy depends on economic data, but rates are generally expected to remain high for an extended period.
- The U.S. job market is generally stable, with recession warning indicators like the Sahm Rule not yet triggered. However, market concerns about economic prospects persist.
- From the CPI data structure, inflationary pressures in food, energy, and goods are easing, but service sector inflation remains difficult to cool, especially in items like rent and auto insurance.
- Market rate expectations drive the performance of risk assets. Cryptocurrencies are more affected by macroeconomic factors, and Bitcoin is not a safe-haven asset. The bond market reflects the Fed’s policy stance and may continue to fluctuate in the short term.
- Overall, U.S. inflation has peaked and is falling, with controllable recession risk. However, market sentiment may remain volatile before the Fed’s attitude turns dovish. Investors should remain sensitive to policy expectations and adjust positions flexibly.
▶ Buy Bitcoin at Binance
Enjoy up to 20% off on trading fees! Sign up Now!
Looking for the latest scoop and cool insights from CoinRank? Hit up our Twitter and stay in the loop with all our fresh stories!


