


KEYTAKEAWAYS
- The Sahm Rule indicates potential recession if unemployment rises 0.5% above its 12-month low, currently hovering at the threshold with recent job market data.
- JOLTS data and ISM Services PMI show mixed signals, with job openings higher than expected but services sector contracting, complicating Fed's decision-making process.
- Fed's rate cut stance is crucial, with "preventive" and "rescue" scenarios possible; historical data shows cuts often begin before inflation reaches 2%, affecting risk assets.
- KEY TAKEAWAYS
- THE JOB MARKET WILL DETERMINE THE ECONOMIC DIRECTION IN THE SECOND HALF OF THE YEAR
- THE LABOR MARKET AS SEEN BY THE ST. LOUIS FED
- U.S. JOLTS JOB OPENINGS HIGHER THAN EXPECTED
- FED MEETING MINUTES RELEASED
- NONFARM PAYROLLS AND WEEKLY INITIAL JOBLESS CLAIMS HIT HIGH
- ISM SERVICES PMI HITS LOWEST POINT SINCE 2020
- THE “RATE CUT” STANCE IS IMPORTANT
- DISCLAIMER
- WRITER’S INTRO
CONTENT
Explore the Federal Reserve’s challenges as job market trends shape the 2024 economic landscape. Understand the Sahm Rule, JOLTS data, and potential rate cuts impact on investments and market dynamics.
THE JOB MARKET WILL DETERMINE THE ECONOMIC DIRECTION IN THE SECOND HALF OF THE YEAR
Do investors remember when Powell said at the postmeeting press conference that “an unexpected slowdown in the job market would prompt us to cut rates earlier”? But what exactly would this “unexpected” scenario look like? Today, I want to discuss this topic further and try to deduce what Powell’s ideal job market might look like.
First, I often mention that Powell’s observation of the labor market largely depends on changes in the “unemployment rate.” This brings us back to the “Sahm Rule” that we’ve taught before. This indicator is very simple: “If the three-month average unemployment rate rises 0.5 percentage points or more above its low from the previous 12 months, the economy is in a recession.”
Interestingly, CNBC recently published an interview with the scholar behind the Sahm Rule, Claudia Sahm, an economist at the Federal Reserve System. This scholar is warning about the current risks faced by the Fed, believing that if the Fed doesn’t cut rates soon, the U.S. economy could fall into recession.
With this formula, I want to lead readers through a calculation to determine under what conditions we can consider the U.S. economy to be in a recession.
First, according to May’s unemployment rate of 4%, looking back two months we see rates of 3.9% and 3.8%. If we average these three months to 3.9%, the difference from 2023’s lowest unemployment rate of 3.4% is still “0.5,” indicating that the Sahm Rule has not yet been established, but is hovering on the edge.
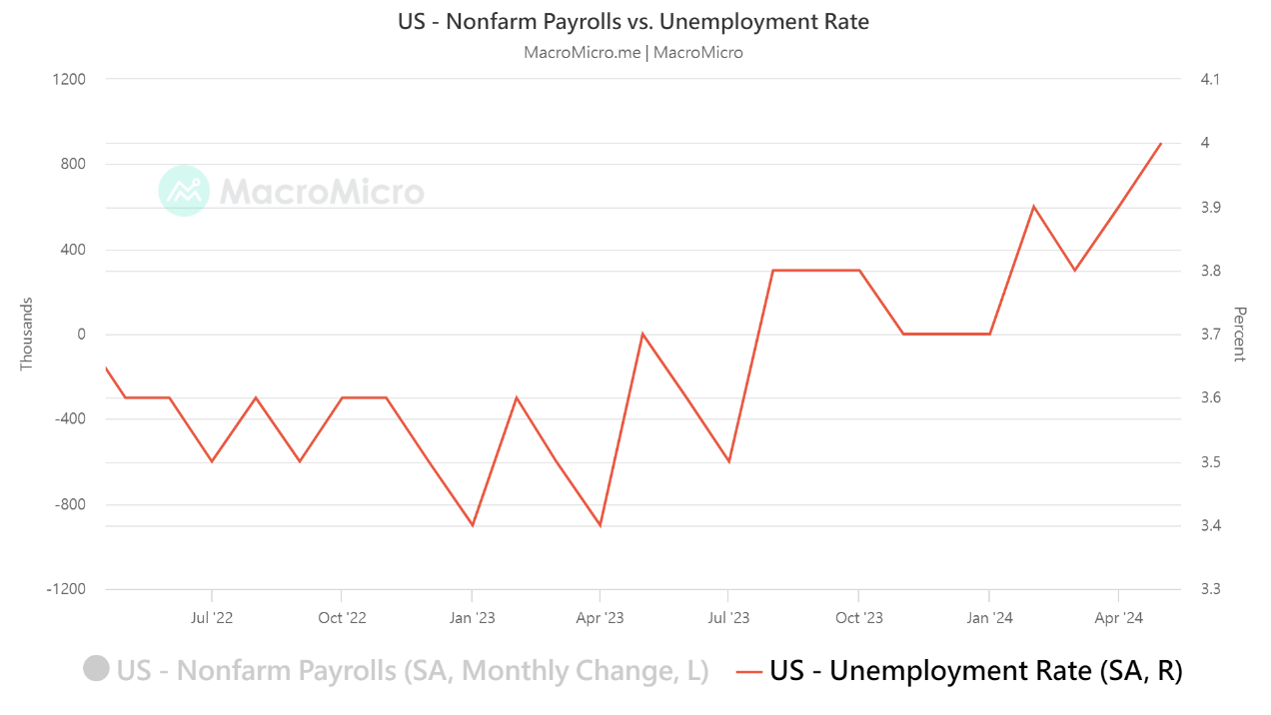
(Source: MacroMicro)
However, given the recent rise in unemployment rates, if June and July’s unemployment rates both remain at 4.1%, then on the day August data for July is released, the Sahm Rule would fully meet the definition of recession. This implies that the U.S. economy may be experiencing a recession. For readers, I believe there are two important concepts to grasp:
- Unemployment Rate Level
The current unemployment rate is at 4%. Although Powell hasn’t explicitly stated what level of job market slowdown would be “unexpected” to him, if we use the Sahm Rule as a guide, seeing the unemployment rate hovering above 4.1% would already meet the Sahm Rule’s definition of recession. This is a concept we can keep in mind.
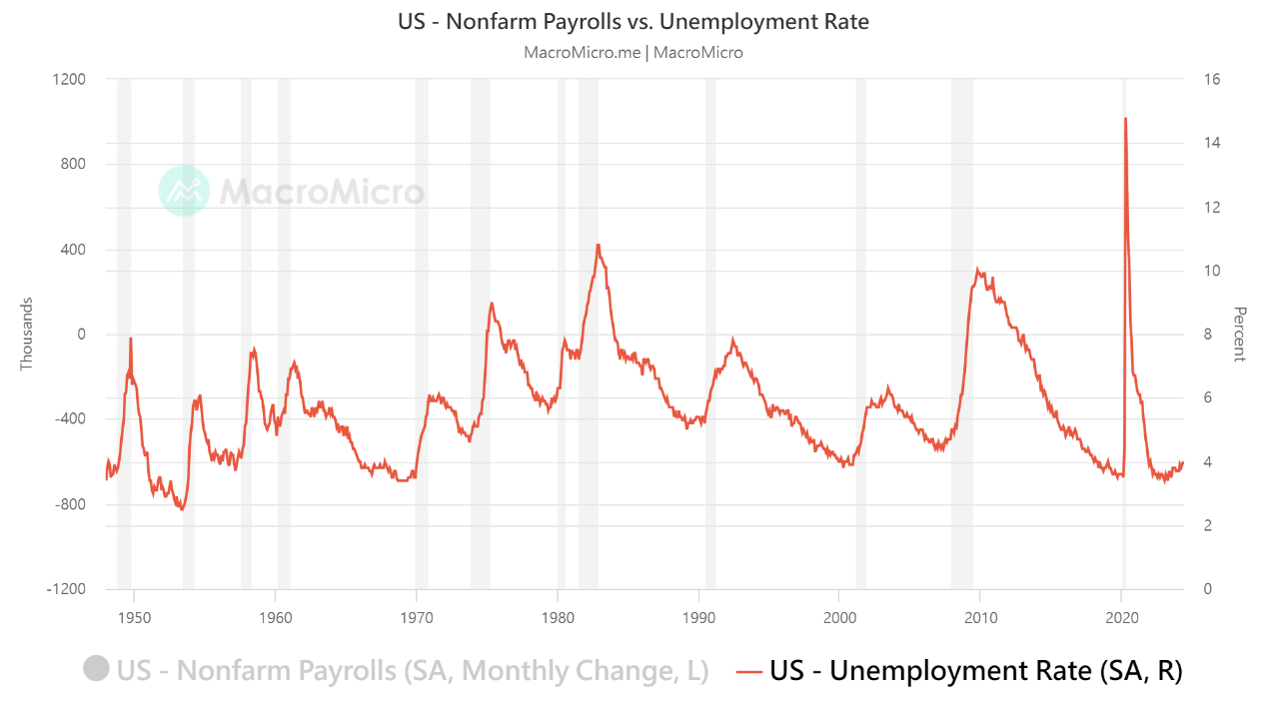
(Source: MacroMicro)
- Speed of Unemployment Rate Increase
However, it’s not just about absolute numbers. We also need to consider the speed of change. From the above chart, we can clearly see that the rise in unemployment rates is often unstoppable and steep. If the unemployment rate truly breaks through the average figure as it has in the past and starts to soar, it would be quite thorny. However, unlike in the past, Powell has mentioned multiple times that “the speed of unemployment rate increase is slow, and he doesn’t feel that the entire labor market is heading towards an uncontrollable situation.”
But if we see the unemployment rate rising by 0.1% each month, and it’s continuous rather than fluctuating like 3.9%, 3.8%, 4.0%, then this speed might lead the Fed to believe that the labor market is worse than expected. This could very likely trigger what Powell himself considers “unexpected,” and the Fed might cut rates earlier.
Sahm Rule Definition:
- Calculation method: The average unemployment rate over the past three months minus the lowest unemployment rate in the past year.
- Threshold: If the difference exceeds 0.5, the economy may be entering a recession.
Current situation:
- May unemployment rate is 4%.
- The Sahm Rule has not yet been met.
- If June and July unemployment rates remain at 4.1%, the Sahm Rule will be met, with the timing in August.
All of this will influence the Fed’s response. I assume that in the July Fed meeting, they still want to see more data and don’t plan to cut rates, nor do they provide guidance for the September meeting. If the July unemployment rate released in August is still bad, then it’s very likely that at the August meeting, the Fed might signal to the market.
However, compared to the Sahm Rule, economists tend to use the OECD indicator or the number of initial jobless claims as indicators to predict economic recession, as these reflect changes in national economic trends and involuntary unemployment. Before the Fed truly defines an economic recession through the unemployment rate, readers can continue to pay attention to changes in these leading indicators, looking at both absolute numbers and growth rates, to see if there’s a possibility of early detection.
Chris Zaccarelli, an independent consultant alliance member, said: “We believe that unless we fall into a recession, or the Fed changes its interest rate policy from potential rate cuts to actual rate hikes, the bull market we’re in won’t derail. We expect volatility from now until the end of the year, but don’t expect the bull market to end without changes in the economy or the Fed’s stance.”
THE LABOR MARKET AS SEEN BY THE ST. LOUIS FED
I’ve shared before about the different directions or perspectives we can take when observing changes in the job market. Next, I want to share another observational angle with readers, which is to observe changes in the labor market through the terminology used by U.S. companies in their earnings calls (as far as I know, there are fewer databases or units in Taiwan that statistically analyze the significance of terminology used by Taiwanese companies in their earnings calls, but this is quite common in the U.S.).
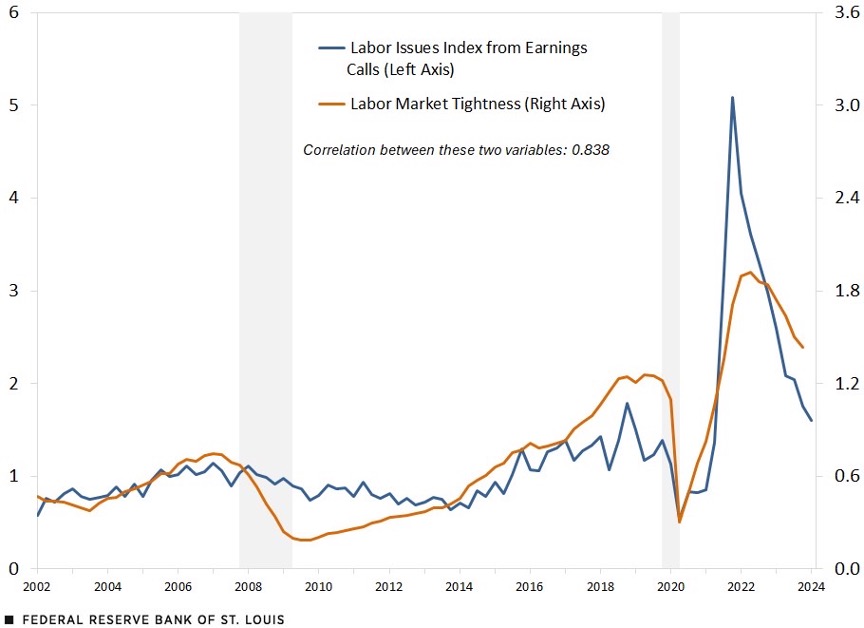
When the labor market is tight and short-staffed, companies will more frequently discuss issues such as rising wage costs, labor shortages, and recruitment difficulties in their earnings calls. Researchers at the Federal Reserve Bank of St. Louis use these terms and calls to measure the degree of labor market tightness.
Looking at the above chart, we can see that the blue line represents the curve of labor market mentions in earnings calls, while the yellow line represents the actual labor shortage change curve. Basically, when we observe these two lines together, we find that they have a positive correlation. What does this mean?
Readers can consider that the investments we make now are actually related to activities in the real world. And those who feel these activities most deeply, apart from the consumer end, definitely include the production and manufacturing end. Through the speeches in earnings calls, we can actually sense the changes in the frontline workforce, because companies must constantly face changing market conditions, and their perceptions will be deep.
Rather than observing changes in oil prices or freight rates (of course, I don’t deny the importance of direct observation), if we want to have a multi-faceted perspective to view market changes, directly listening to whether operators are affected by freight rates or oil prices, and to what extent, can be another observational angle.
For example, the earnings reports of non-essential businesses like Walmart, Coca-Cola, or Starbucks are nothing but attempts to present real changes in U.S. retail consumption and to see if there are signs of inflation rebounding through the eyes of businesses. I find this method interesting, as it allows us not to just face cold numbers, but to get closer to the image of economic activities in the real world.
U.S. JOLTS JOB OPENINGS HIGHER THAN EXPECTED
(Source: MacroMicro)
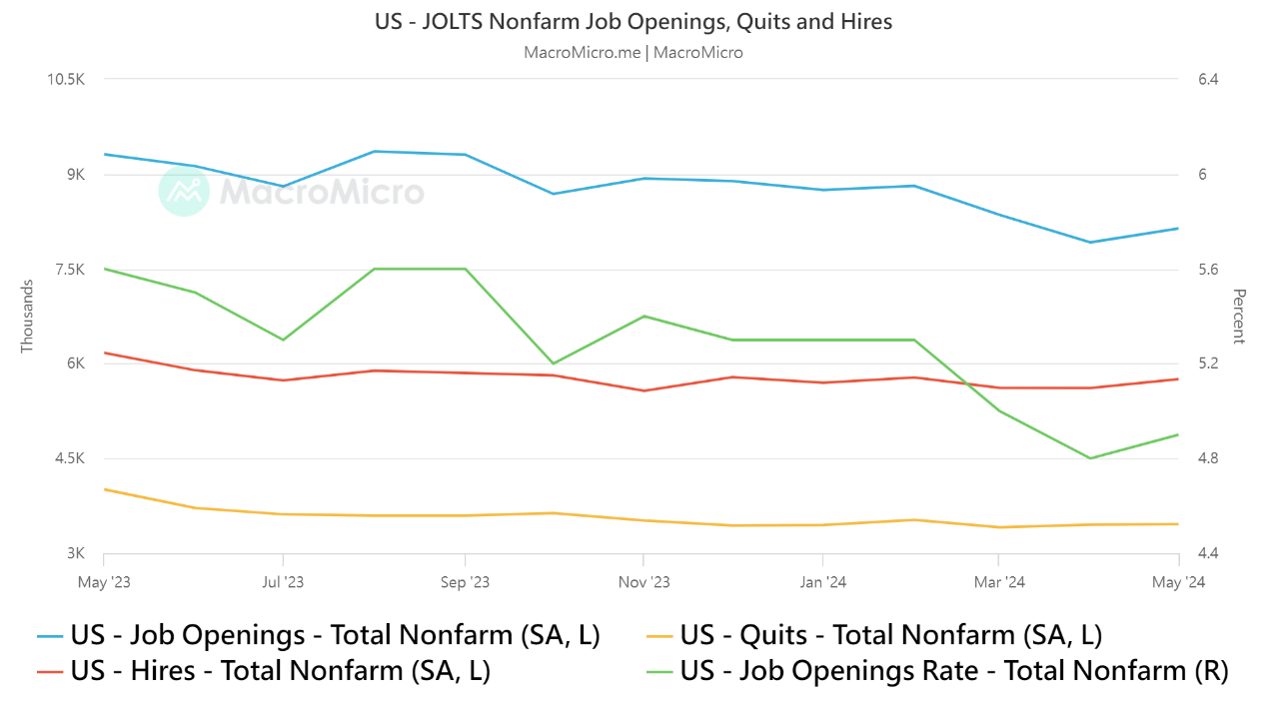
Next, let’s look at the latest U.S. Job Openings and Labor Turnover Survey (JOLTS) report that was just released. From the data, we can see that job openings slightly increased in May, the first time in three months, rising from April’s downwardly revised 7.919 million to 8.14 million, higher than the expected 7.96 million openings.
Simply put, the JOLTS report is a monthly survey of job openings, hiring, and separations (quits, layoffs, discharges) released by the Bureau of Labor Statistics. Unlike the unemployment rate, which measures the supply side of the labor market, JOLTS data helps measure labor demand.
However, although the JOLTS data shows an increase in labor demand, I still think it’s difficult to conclude that the job market is strong from just one month’s data, especially when other data indicate that the job market is slowly cooling. Here, I’m referring to what I consider to be the more important “job openings rate” data.
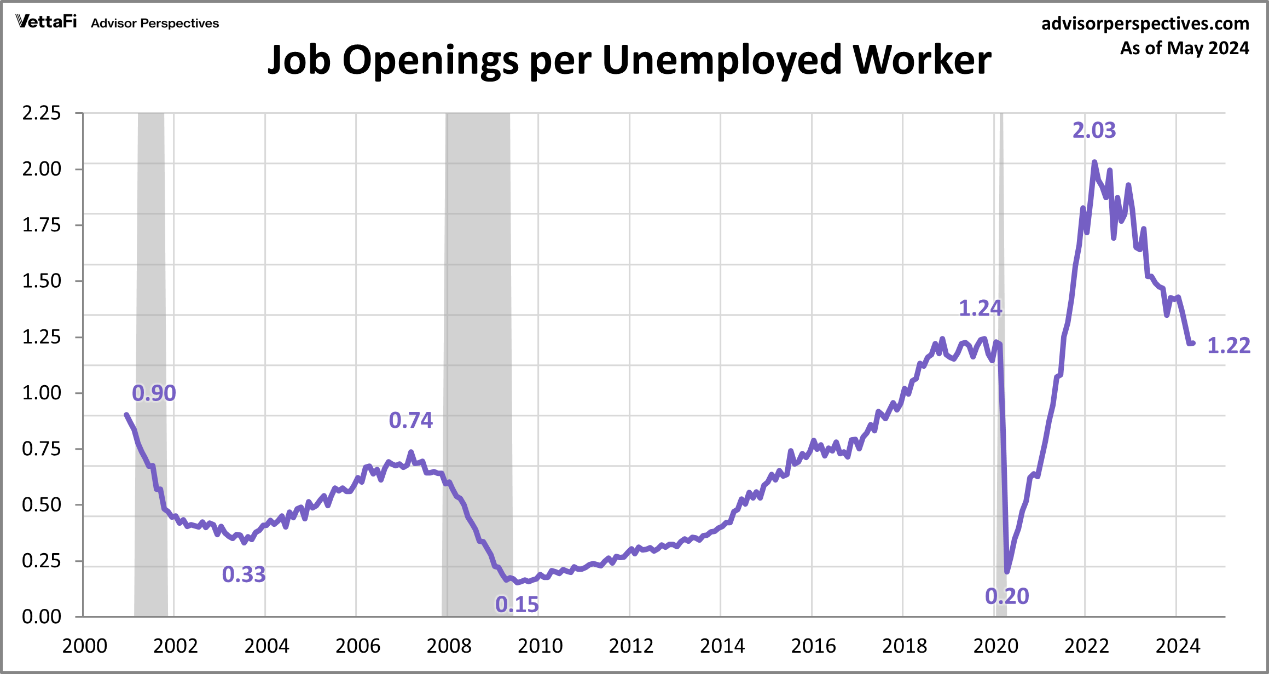
Overall, are job openings in the labor market important? They are quite important, but there’s another set of even more important data that will be released, which is the job openings in the labor market divided by the number of unemployed people in the entire market. From the above chart, we can see that the purple line ratio is around 1.22 now, which means there are 1.22 job openings for every unemployed person.
The Fed more often uses this indicator or ratio to measure the current activity level of the labor force. If we look to the left for comparison, we’ll find that this set of data has returned to pre-pandemic levels when compared to before the pandemic. Overall, the labor market is indeed still slowing down, at least in the Fed’s eyes.
Bloomberg economist Paul Stewart also believes: “The labor market is cooling. The monthly increase in job openings mainly comes from government positions, and the ratio of job openings to unemployed people has returned to pre-COVID levels. As this ratio continues to decline and the labor market cools, we believe the Fed may cut rates twice this year.”
FED MEETING MINUTES RELEASED
Lastly, I want to summarize the job market through the Fed’s meeting minutes. On July 4th, the Fed released their meeting minutes, which showed that officials did not think lowering interest rates was appropriate unless more data “gave them more confidence that inflation was moving towards the 2% target.”
Simply put, there wasn’t much change in the explanation of inflation, although “some” officials emphasized the need for patience, and if inflation remains high, some policymakers are still willing to raise rates.
However, from my perspective, I’m not surprised by the hawkish voices in the meeting minutes. From the last interest rate median, we can sense that Fed members are debating internally, and the decline in rate cut expectations further proves that members are indeed becoming more pessimistic about the number of rate cuts.
But what’s the key point? Of course, it’s still Powell’s view on rate cuts. From the last post meeting press conference, we can see that “Powell still wants to downplay the idea of hawkish voices.” If Powell doesn’t particularly want to emphasize the possibility of rate hikes, then we don’t need to worry too much about shifting from rate cut expectations back to rate hike expectations.
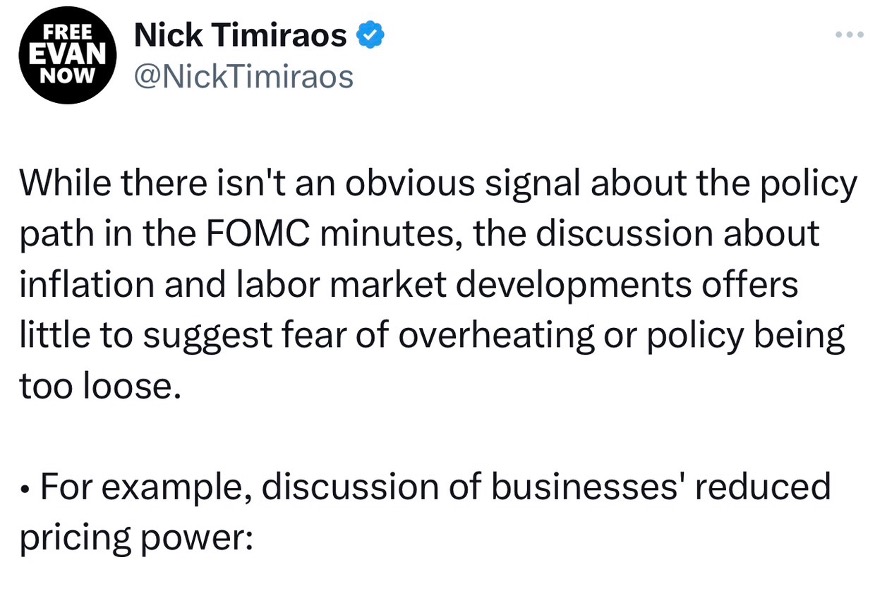
(Source: X)
For me, the focus of the meeting minutes is not on the discussion of rate hikes or cuts, but on “some” participants particularly emphasizing the possibility that further weakening of demand could lead to a significant rise in the unemployment rate. This point coincides with what I saw while scrolling through X, where the Fed’s mouthpiece NICK put forward related views, stating that there were no clear policy path signals in the Fed’s meeting minutes, and that the focus on inflation and the labor market is not on the discussion of economic overheating or policy easing.
On the contrary, it focuses on the risks of economic downturn. Members pointed out that the supply and demand in the labor market continue to balance. Many labor market indicators show that the tightness of the labor market has eased. These include: a decline in the job openings rate, a decrease in the quit rate, an increase in part-time work for economic reasons, a decline in the hiring rate, a further decrease in the ratio of job openings to unemployed persons, and a gradual rise in the unemployment rate.
Many members pointed out that labor supply has been boosted by increases in labor force participation and immigration. Recent immigrants are gradually becoming part of the labor force. Past immigration trends may continue to increase labor supply, but will not become the main source of labor supply. Especially as Powell has begun to explain to the market that although employment growth remains strong, monthly employment growth may not be higher than in the past, especially as employment surveys (non-farm payroll data) may overestimate actual employment growth.
As the labor market tends to balance, labor market conditions need to be carefully monitored. This is a factor with uncertainty. Members also expressed that they believe the continued strength of the labor market would hinder the achievement of the Federal Open Market Committee’s (FOMC) dual mandate (employment and inflation targets), although they have begun to notice the softening pace of the labor market.
NONFARM PAYROLLS AND WEEKLY INITIAL JOBLESS CLAIMS HIT HIGH
(Source: MacroMicro)
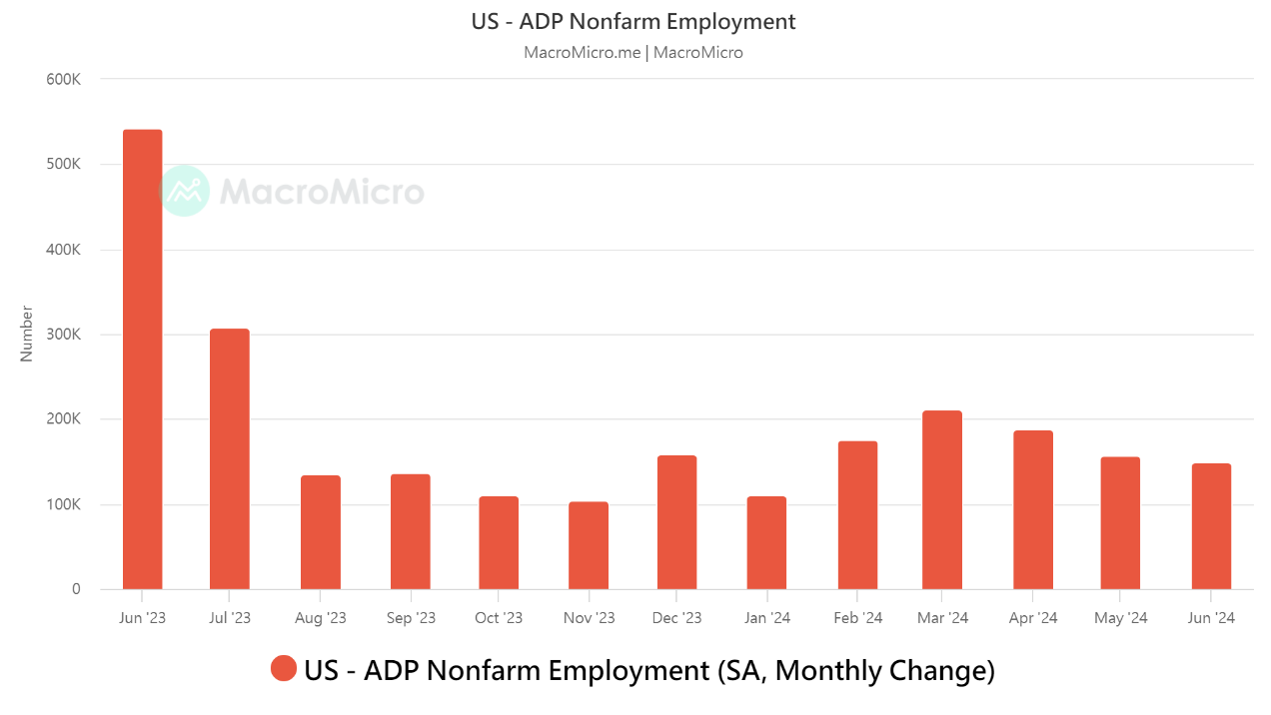
Continuing with the content of the Fed’s meeting minutes, I want to directly discuss the latest labor force data. From the above chart, we can see that U.S. ADP employment increased by 150,000 in June, significantly lower than the expected 165,000, and slightly down from the previous value of 152,000. This is the third consecutive month of decline in ADP employment, and the lowest level in four months, indicating that the job market is “continuously” slowing down.
However, for me, the nonfarm payroll data is not the most important. The key is actually the wage data released simultaneously, showing that wage growth for job changers slowed for the third consecutive month in June, with an annual increase of 7.7%, while the annual increase for incumbent workers was 4.9%, the lowest level since August 2021. The slowdown in wage growth is gradually approaching pre-pandemic levels, which better highlights changes in the job market, especially when the nonfarm payroll is not a good indicator for the large non-farm payroll.
ADP Chief Economist Nela Richardson said: “Employment growth has been steady, but the foundation is not broad. If it weren’t for the rebound in hiring in the leisure and hospitality industry, June would have been a disappointing month.”
Coincidentally, data released on the same day by human resources consulting firm Challenger, Gray & Christmas Inc. showed that U.S. employers announced 48,786 job cuts in June, the highest for the same month since 2009, excluding 2020 when the COVID-19 pandemic was at its worst.
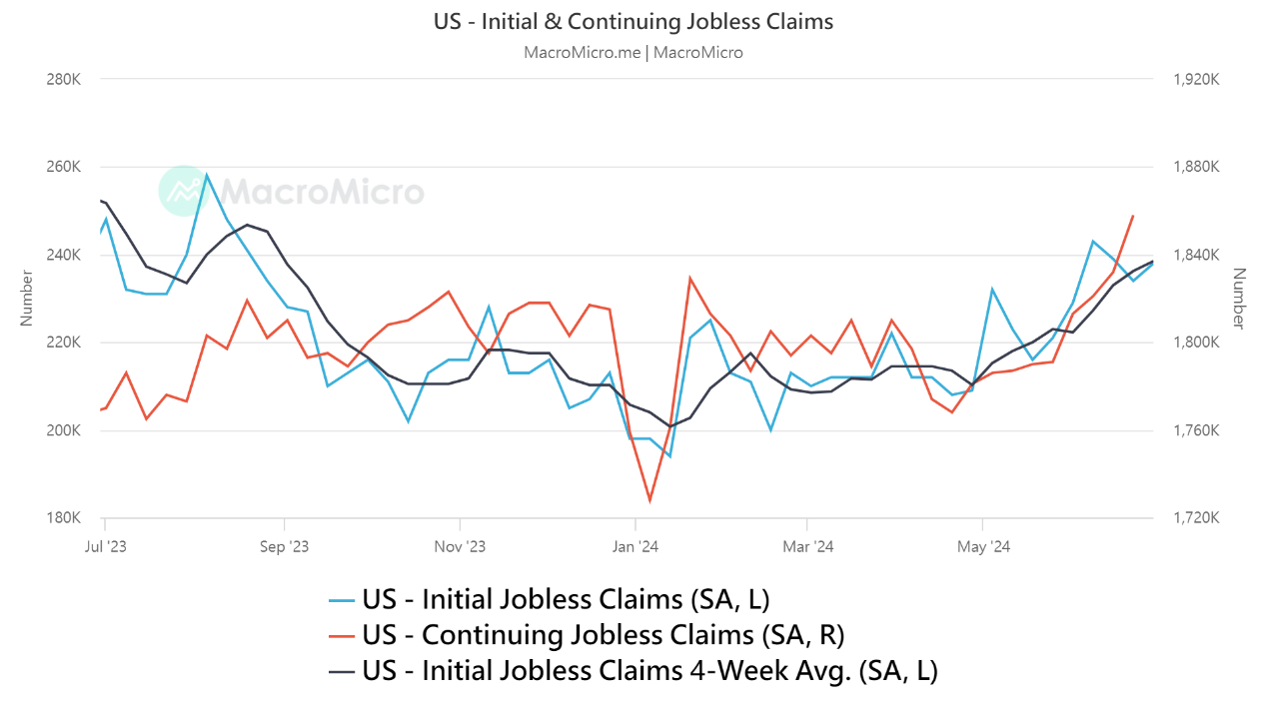
In addition, U.S. initial jobless claims last week were 238,000, exceeding the expected 235,000, reaching the highest level since January this year. And continuing jobless claims rose for the ninth consecutive week to 1.86 million, the highest level since November 2021.
(Source: MacroMicro)
But please pay attention, investors, weekly initial jobless claims are data that can easily fluctuate greatly. We can use the four-week moving average, which eliminates short-term fluctuation factors, to observe changes in employment conditions, which will more realistically present continuous progress.
From the above chart, we can see that this number has surged to 238,500, which is also proof of continuous job market slowdown, and has exceeded the average number of people applying for unemployment benefits before the 2020 pandemic, indicating that it’s really taking longer for unemployed people to find new jobs.
(Source: CME)
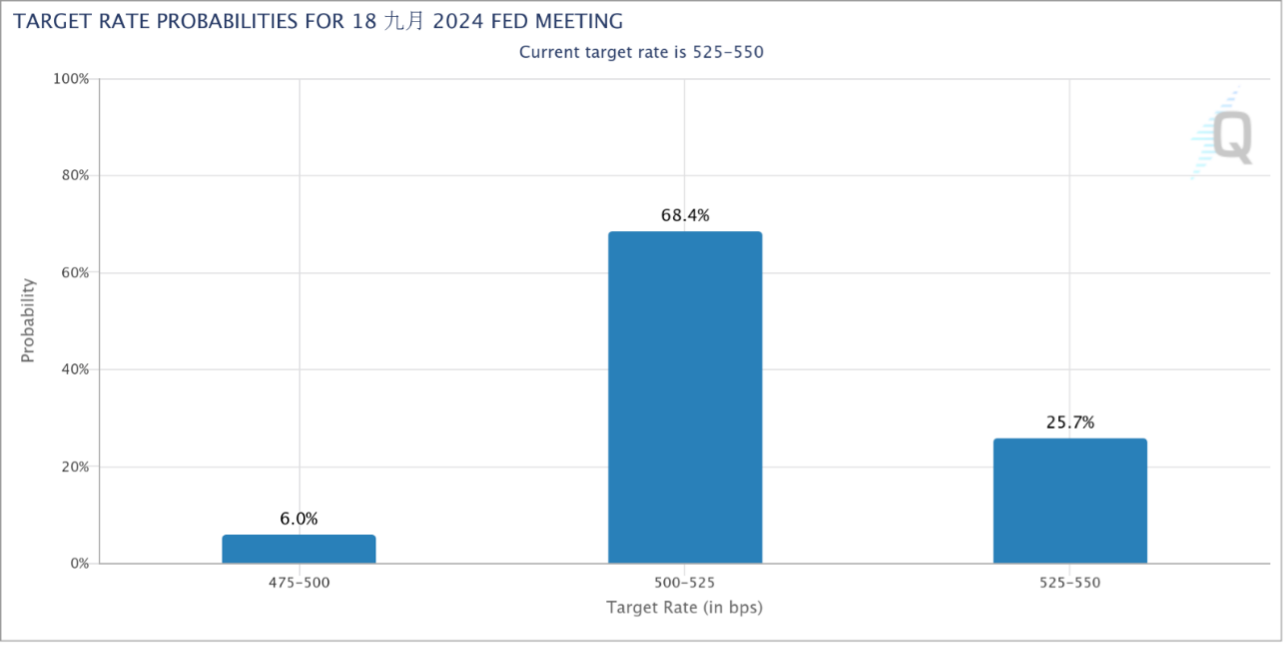
After the data was released, expectations for a Fed rate cut in September increased again, currently above 68.4%. Overall, the probability of two rate cuts this year is slowly increasing.
For the Fed, this moment has become more critical because, based on past experience, once the labor market slowdown begins, it accumulates rapidly. Due to the economic slowdown caused by the financial crisis, the unemployment rate gradually rose from 4.4% in March 2007 to 5.1% a year later. As the recession continued, the unemployment rate rose faster, reaching 7.3% by the end of 2008 and peaking at 10% the following year. Will it be different this time? The upcoming “unemployment rate” data will be crucial.
ISM SERVICES PMI HITS LOWEST POINT SINCE 2020
(Source: MacroMicro)
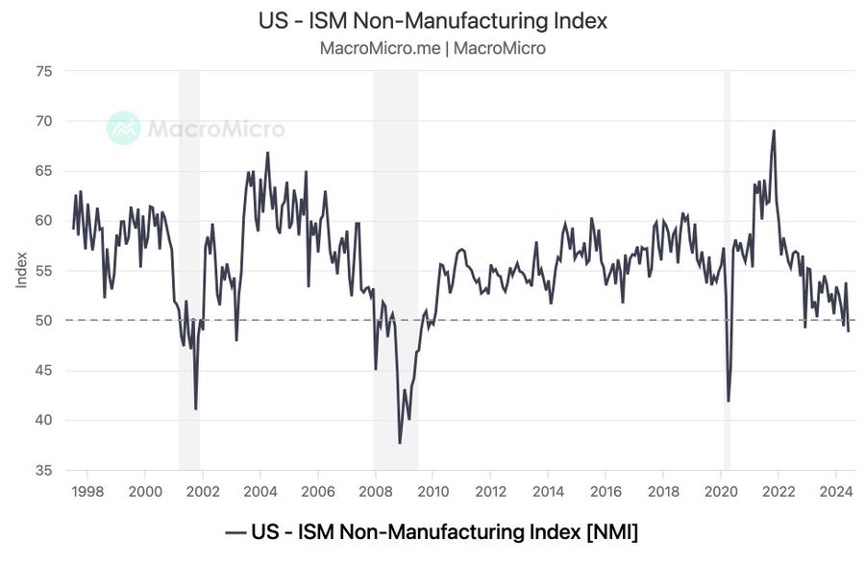
Finally, let’s look at the changes in the U.S. ISM Services Index for June. Surprisingly, it was far below expectations. Due to a sharp decline in business activity and order slump, the U.S. ISM Services Index for June was 48.8, far below the expected 52.6 and the previous value of 53.8. Service industry activity contracted, and the speed of contraction was the fastest in four years.
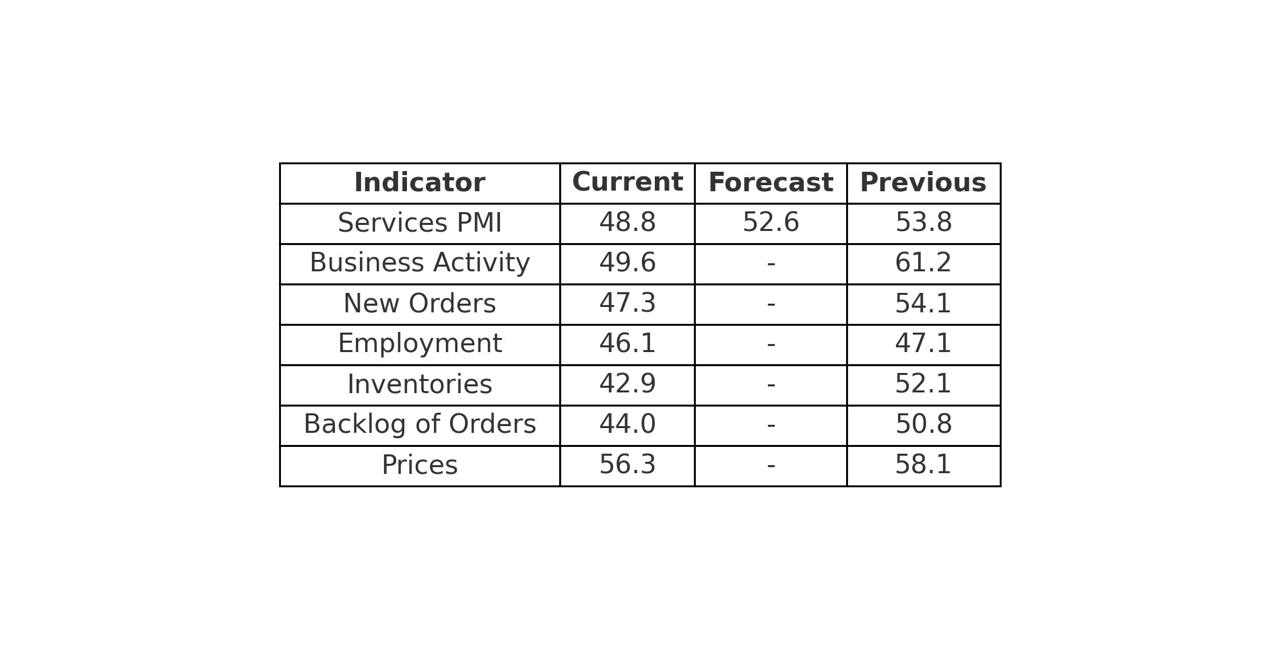
From the table above, we can see that the decline compared to the previous value is indeed very rapid, with many figures already below 50, which represents the dividing line between expansion and contraction.
(Source: Federal Reserve Bank of Atlanta)
Although these data indicate further slowdown in inflation, consolidating market expectations for rate cuts, I want to remind readers that if we see continuous declines in such indices as PMI or PPI, while the job market is also slowing down, then we may need to pay special attention to whether the speed of economic slowdown is too fast.
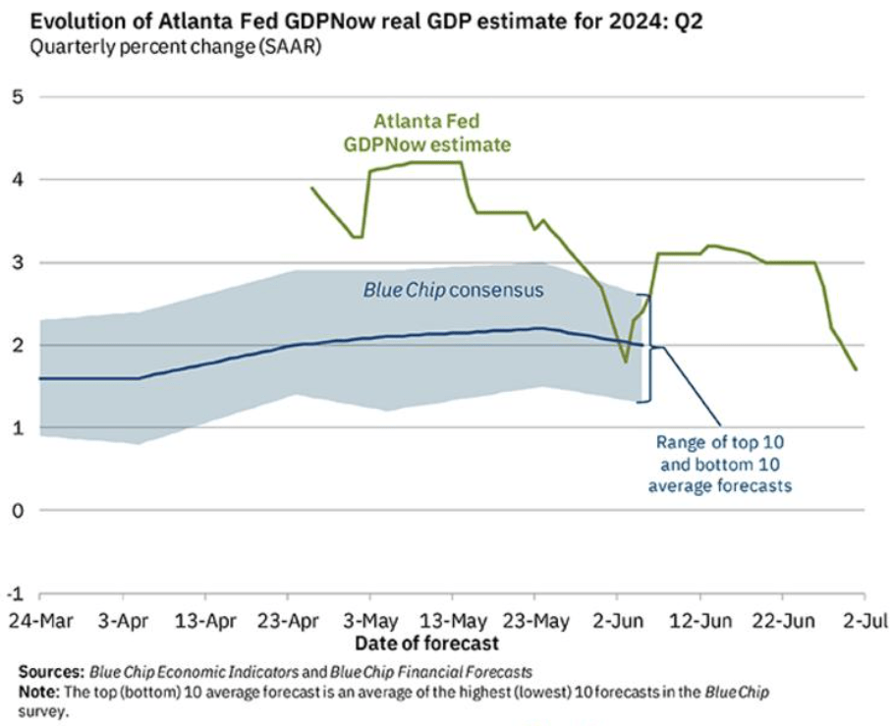
According to estimates from the Federal Reserve Bank of Atlanta, GDP has now fallen to 1.7%, below Wall Street’s average consensus. The U.S. estimated economic data was at 4.3% just over a month ago, but has now been revised downward. If future revisions continue downward, then the U.S. economy’s strength, which has been apparent due to lag effects, might become problematic.
For this reason, I will continue to pay attention to changes in leading U.S. consumer companies, such as Home Depot, McDonald’s, Walmart, LULULEMON, and Starbucks. Looking at the current stock prices of related non-essential consumer stocks, they’ve all fallen drastically. This could very well be reflecting a worsening economic environment where consumer spending is becoming increasingly cautious. We’ve just been masked by the AI boom. The second quarter earnings reports will tell us what the earnings expectations for the second half of the year really are.
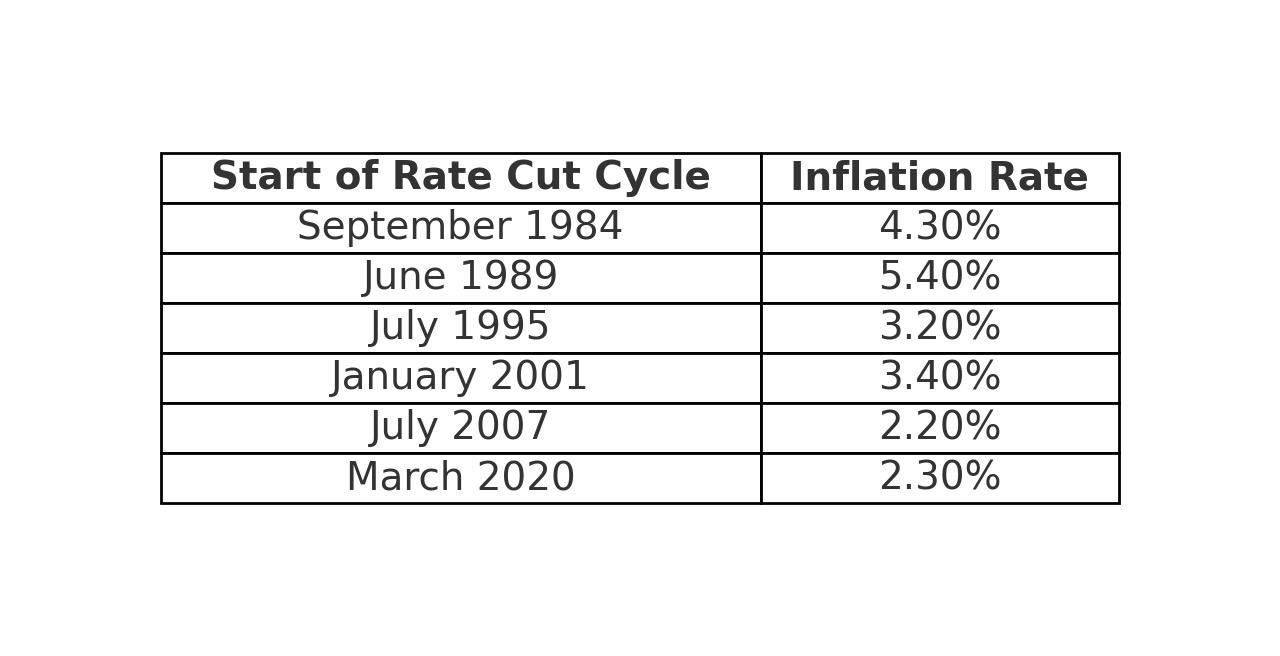
THE “RATE CUT” STANCE IS IMPORTANT
I believe readers now have an outline of the labor market after listening to my discussion above. But what does this mean for investors? Today, we need to seriously explain that the “stance on rate cuts” is very important.
To put it plainly, rate cuts can be divided into two types: “preventive” and “rescue”. When the economy gradually slows down, a “preventive” rate cut is made, or when the economy “unexpectedly” enters a recession, a “rescue” rate cut is made. However, looking back, almost all past rate cuts started before inflation exceeded 2%. This also implies that the Fed won’t wait until inflation falls below 2% to take action. As September approaches, relevant data will become increasingly important. This also means that whether it’s cryptocurrencies or the stock market, risk assets will show huge upward or downward differences under these two different rate cut scenarios. Investors must face this cautiously.