


KEYTAKEAWAYS
- Understand crypto charts and indicators to improve your trading decisions.
- This guide simplifies market analysis for beginners.
CONTENT
Master the basics of reading crypto charts with this comprehensive guide for beginners. Discover the different types of charts, understand key indicators, and learn how to analyze market trends to make smarter trading decisions.
INTRODUCTION
Understanding how to read crypto charts is a fundamental skill for anyone looking to trade or invest in cryptocurrencies. As the crypto market grows, the ability to analyze and interpret these charts has become increasingly important for traders aiming to make informed decisions.
Crypto charts are vital tools that help traders analyze market trends, predict price movements, and make data-driven decisions. In this guide, we will break down the essential components of crypto charts, discuss popular indicators, and provide strategies for analyzing these charts effectively. Whether you are a beginner or looking to refine your chart-reading skills, this comprehensive guide will equip you with the knowledge you need to navigate the complex world of crypto trading.
WHAT ARE CRYPTO CHARTS?
Crypto charts are graphical representations of the price movements of cryptocurrencies over a specific period. These charts provide traders and investors with crucial data to analyze market trends, identify patterns, and make decisions based on historical price behavior.
By examining crypto charts, traders can gain insights into market sentiment and forecast potential price movements. There are several types of crypto charts, each offering unique insights into the market. Understanding the different types of charts is the first step in mastering crypto analysis.
TYPES OF CHARTS
- Line Charts: The most basic type of chart, displaying a line that connects successive closing prices over a specific time frame. Line charts are often used for a quick, simplified view of the overall trend.
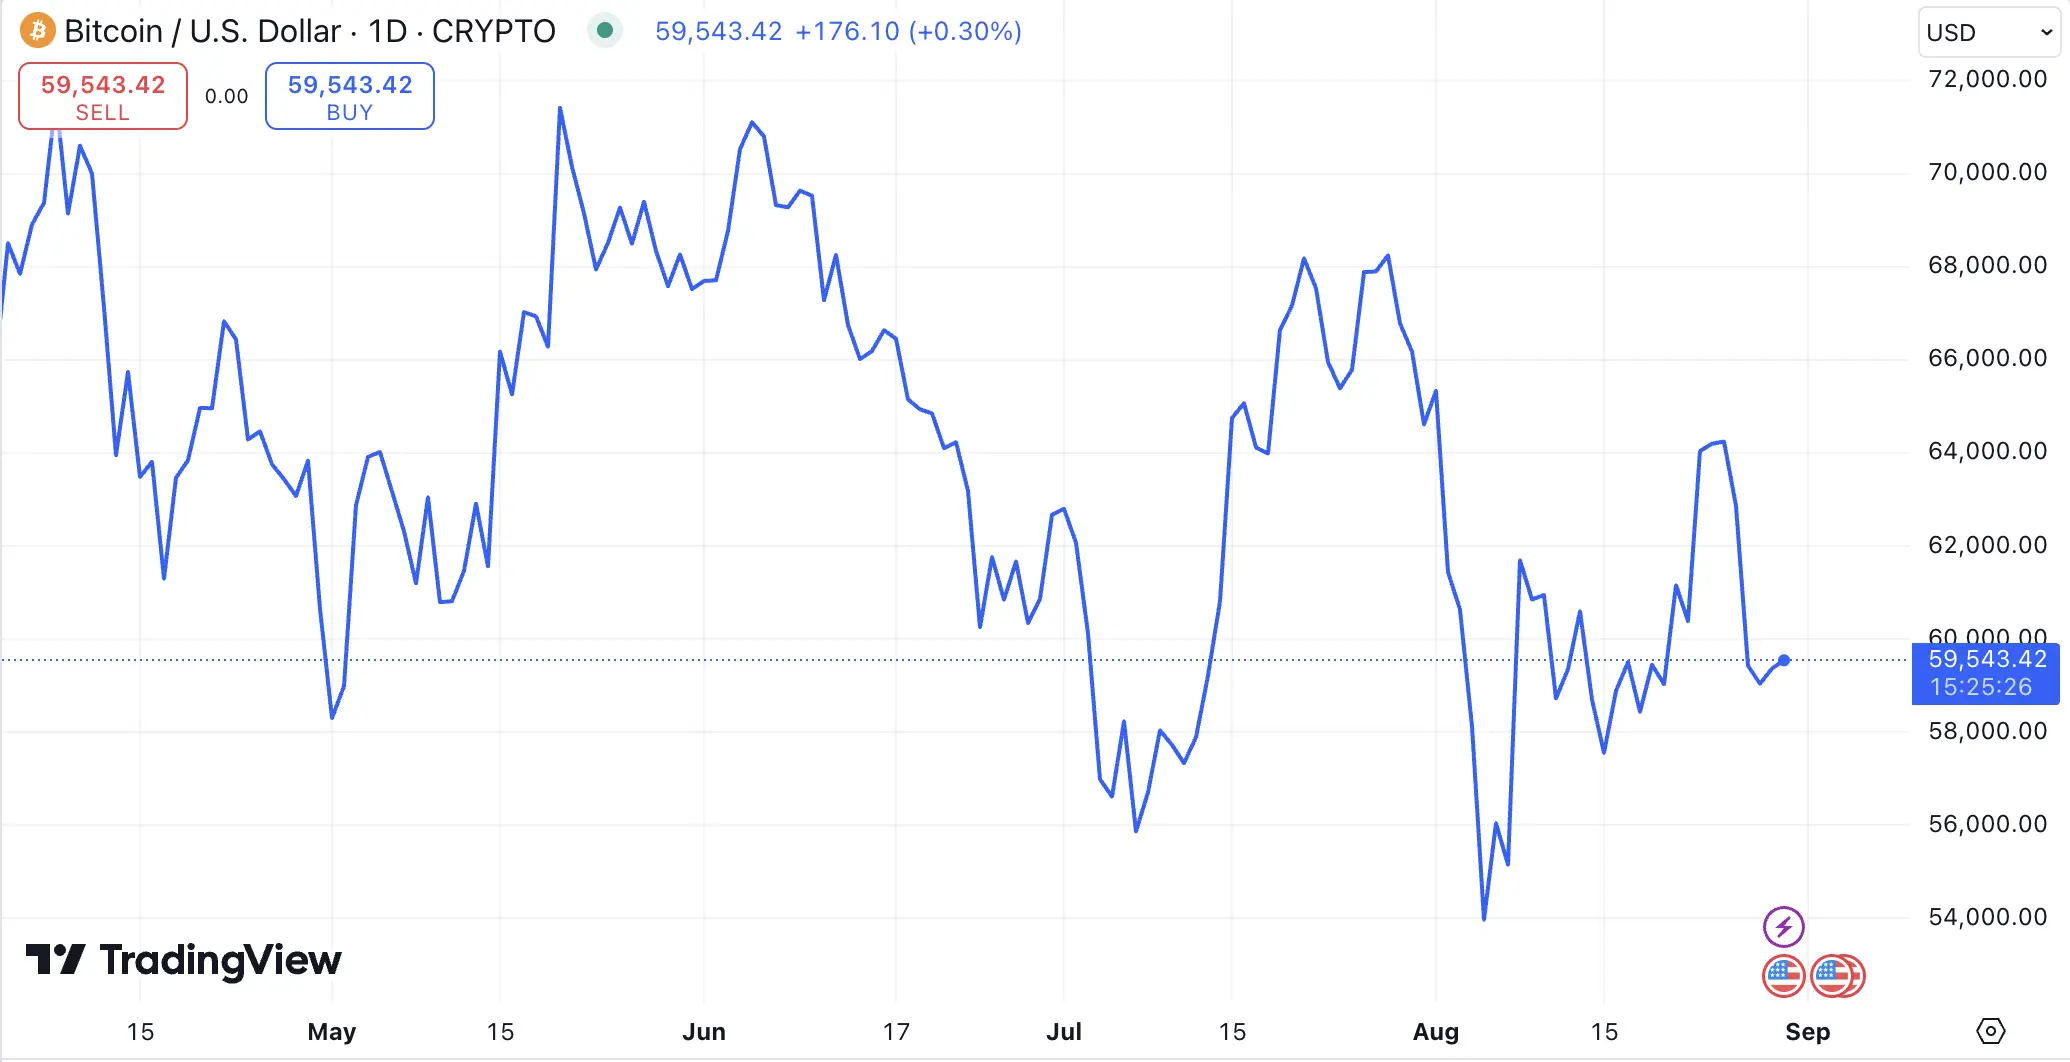
(Source: TradingView)
- Bar Charts: More complex than line charts, bar charts show the opening, closing, high, and low prices for each time period. They provide more detailed information about price fluctuations within a given period.
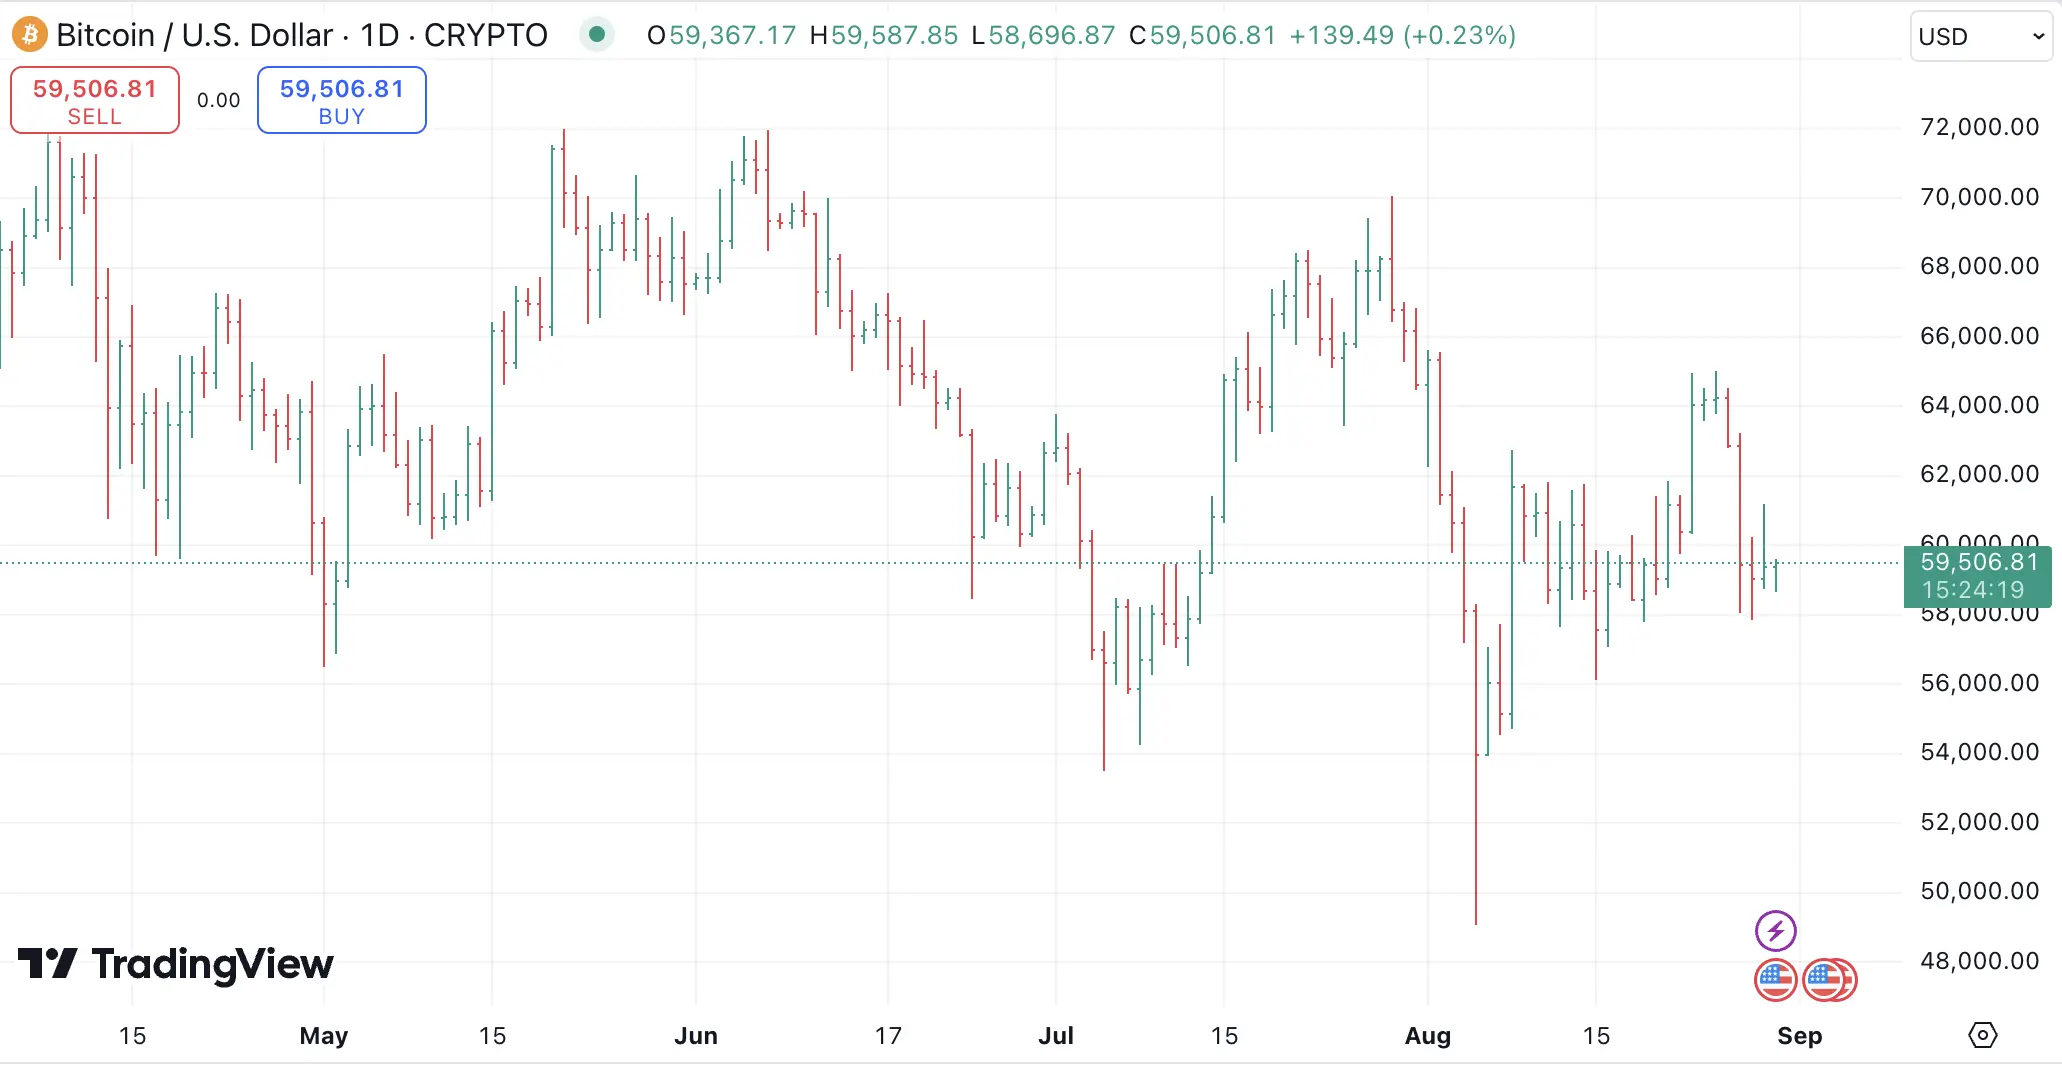
(Source: TradingView)
- Candlestick Charts: The most popular among traders, candlestick charts provide a visual representation of price movements, showing the open, close, high, and low prices for each period in a more detailed manner. These charts are favored for their ability to reveal market psychology through patterns that often predict future price movements.
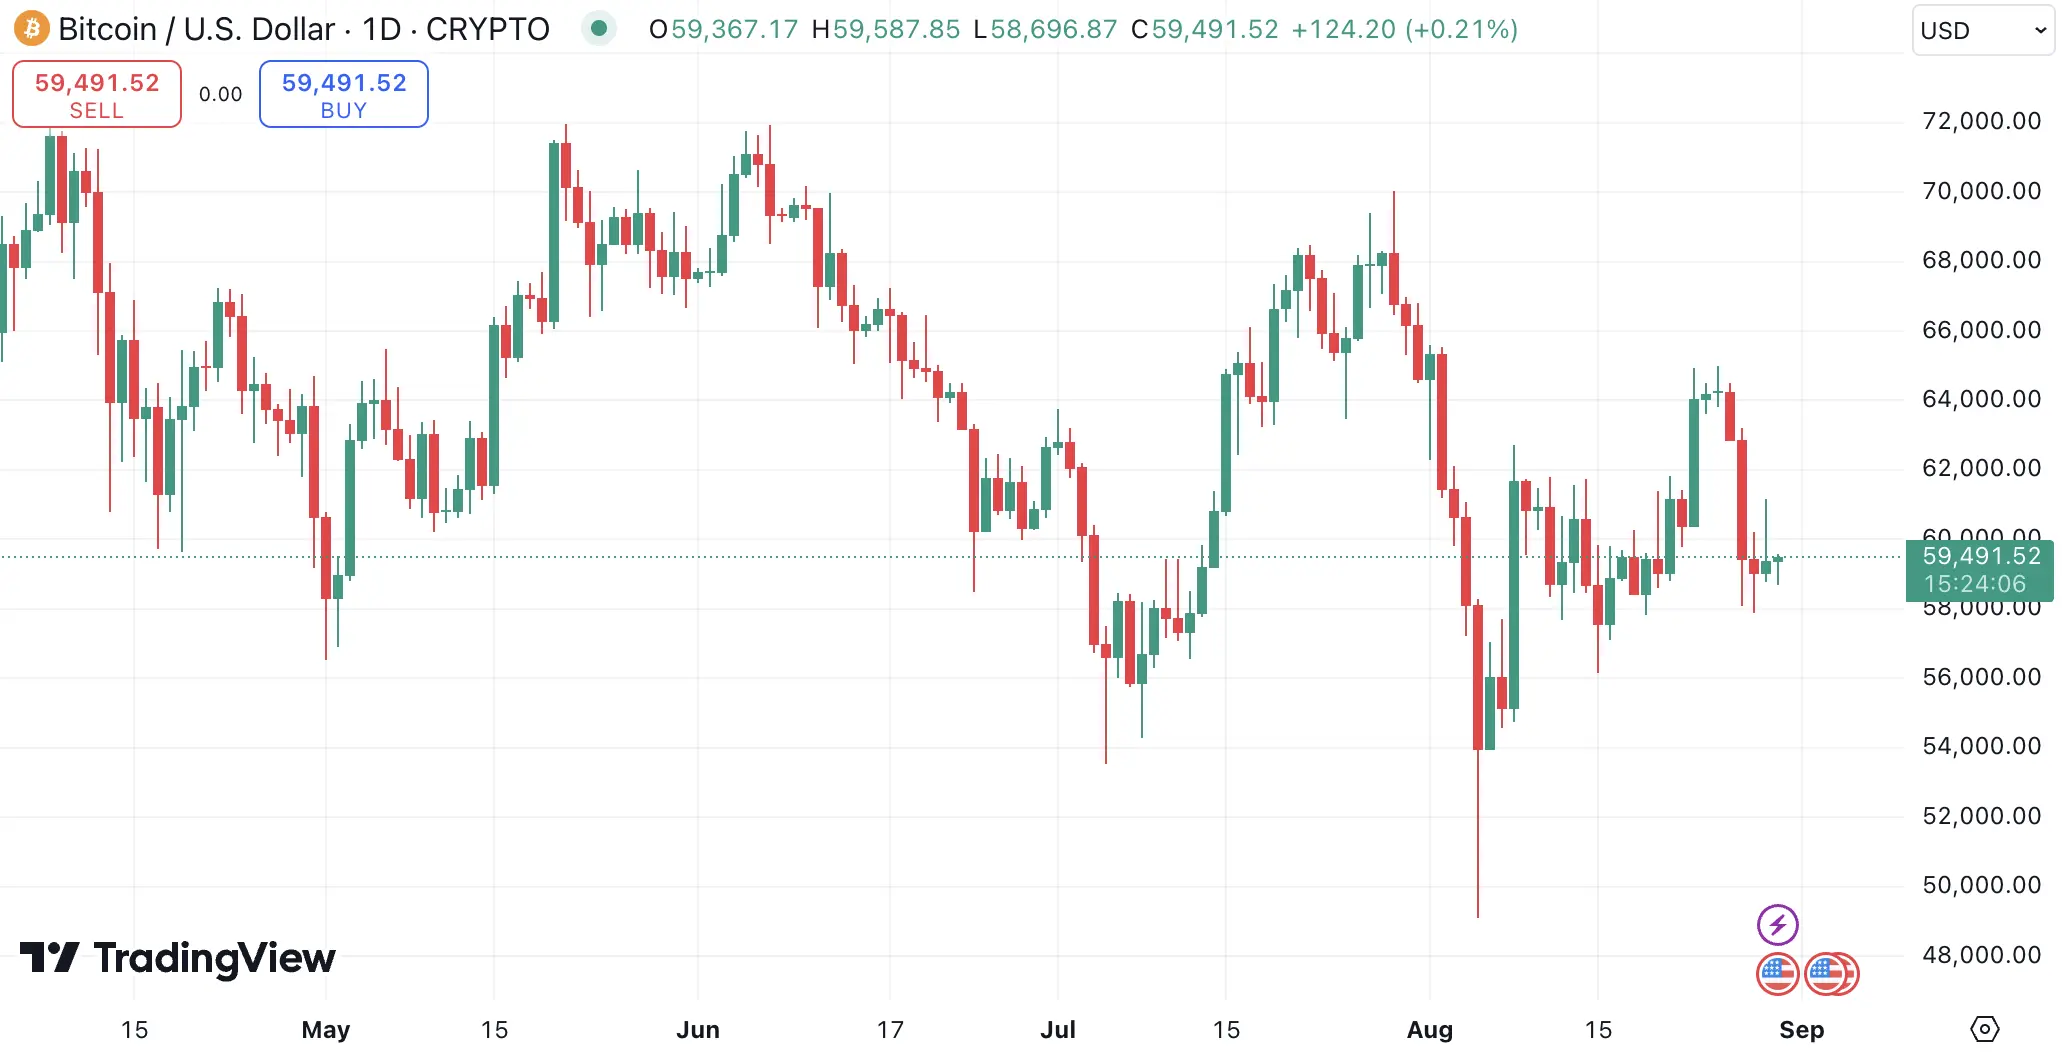
(Source: TradingView)
Why They Matter
Crypto charts are essential because they help traders and investors understand market sentiment, detect trends, and anticipate potential price movements. By mastering the interpretation of these charts, traders can enhance their decision-making process and potentially increase their profitability. For instance, recognizing a trend early on a chart can allow a trader to enter or exit a position at an optimal time, thereby maximizing returns or minimizing losses.
Line Charts
(Source: TradingView)
Explanation: Line charts are simple and straightforward, connecting the closing prices of an asset over a selected period. They provide a clear view of the overall trend of a cryptocurrency without overwhelming the viewer with too much data. Line charts are often used to quickly assess whether a market is in an uptrend, downtrend, or sideways trend.
When to Use: Line charts are ideal for getting a quick overview of a cryptocurrency’s price trend. They are particularly useful for long-term analysis, where the goal is to identify the general direction of the market rather than focusing on the finer details. However, they lack the detailed information that other chart types provide, making them less suitable for short-term trading decisions.
Bar Charts
(Source: TradingView)
Explanation: Bar charts are more detailed than line charts, showing the open, close, high, and low prices for each time period. Each bar represents one period, with the vertical line showing the price range and horizontal ticks indicating the opening and closing prices. This format provides a clearer picture of the price volatility and the market’s trading range during each period.
When to Use: Bar charts are useful when traders need to see the range of price movements within a specific time frame, such as intraday trading. They help traders identify potential reversal points and the strength of price movements. By analyzing the length and position of bars, traders can gauge market momentum and the relative strength of buyers versus sellers during that period.
Candlestick Charts
(Source: TradingView)
Explanation: Candlestick charts are highly favored by traders due to their comprehensive nature. Each candlestick represents a time period and includes the open, close, high, and low prices. The body of the candlestick shows the difference between the open and close prices, while the wicks (or shadows) indicate the highest and lowest prices. Candlestick patterns are often used to predict future price movements, making them a powerful tool in a trader’s arsenal.
When to Use: Candlestick charts are best used when traders need a detailed view of price action, including patterns that can predict future market movements. They are particularly useful for identifying market reversals and continuations, making them a go-to choice for day traders and swing traders who rely on quick and accurate interpretations of market sentiment.
UNDERSTANDING CRYPTO CHART COMPONENTS
To effectively read crypto charts, it’s essential to understand the various components that make up these charts. This understanding allows traders to interpret the data accurately and make informed trading decisions.
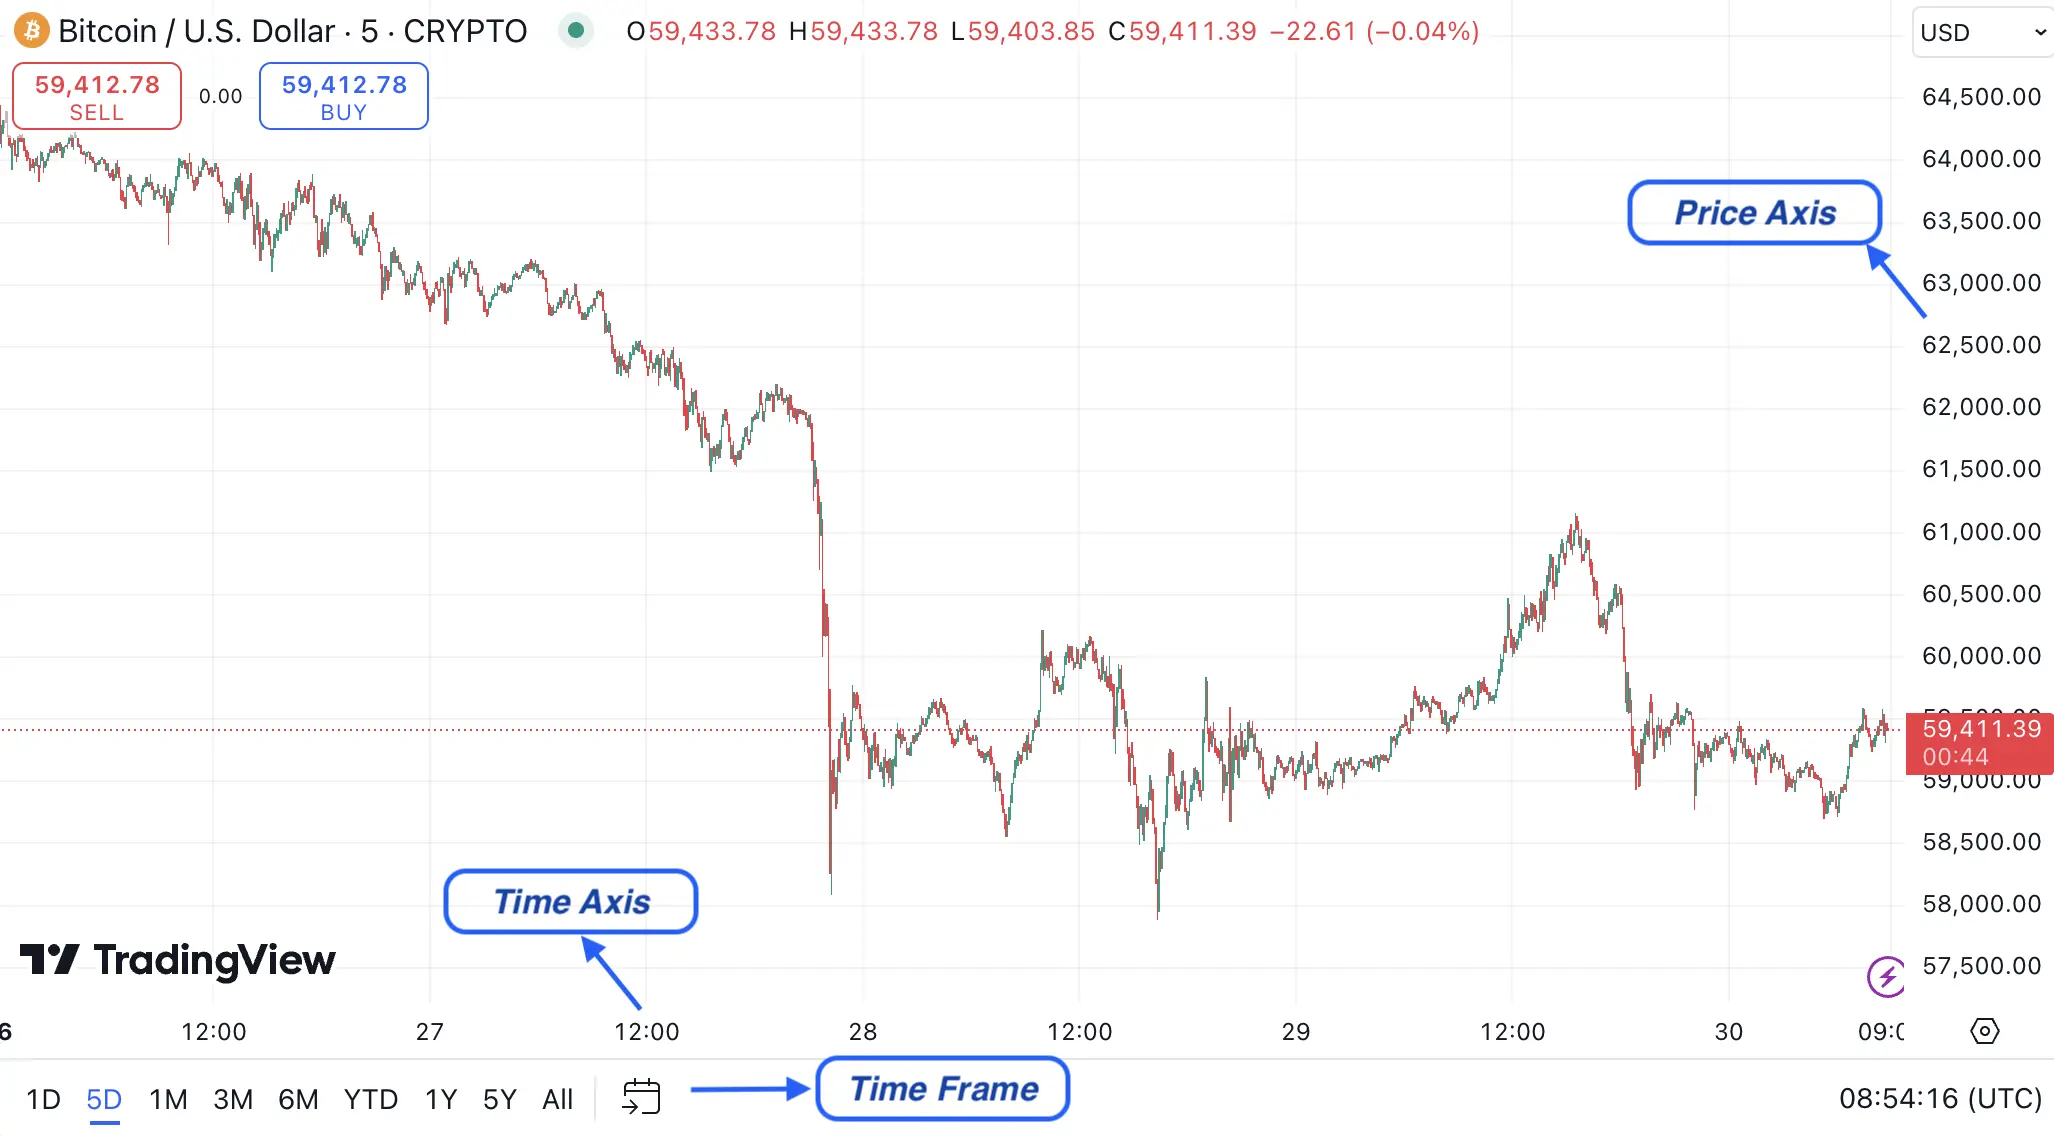
(Source: CoinRank)
Axis
The X-axis on a crypto chart represents time, while the Y-axis represents price. Understanding these axes is crucial for interpreting the data correctly. The X-axis helps traders see how prices have evolved over time, while the Y-axis allows them to gauge the magnitude of price changes.
Time Frames
Time frames can vary from 1 minute to 1 month, depending on the chart. Shorter time frames (e.g., 1-minute or 5-minute) are used for day trading, where the focus is on capturing small price movements within the day. Longer time frames (e.g., daily, weekly) are more suitable for long-term analysis, helping traders identify broader trends and market cycles.
Price Movements
Price movements are depicted through the interaction of buyers and sellers in the market. Upward movements indicate buying pressure, while downward movements indicate selling pressure. Understanding price movements and their underlying causes is key to predicting future market behavior and making profitable trades.
Volume Indicators
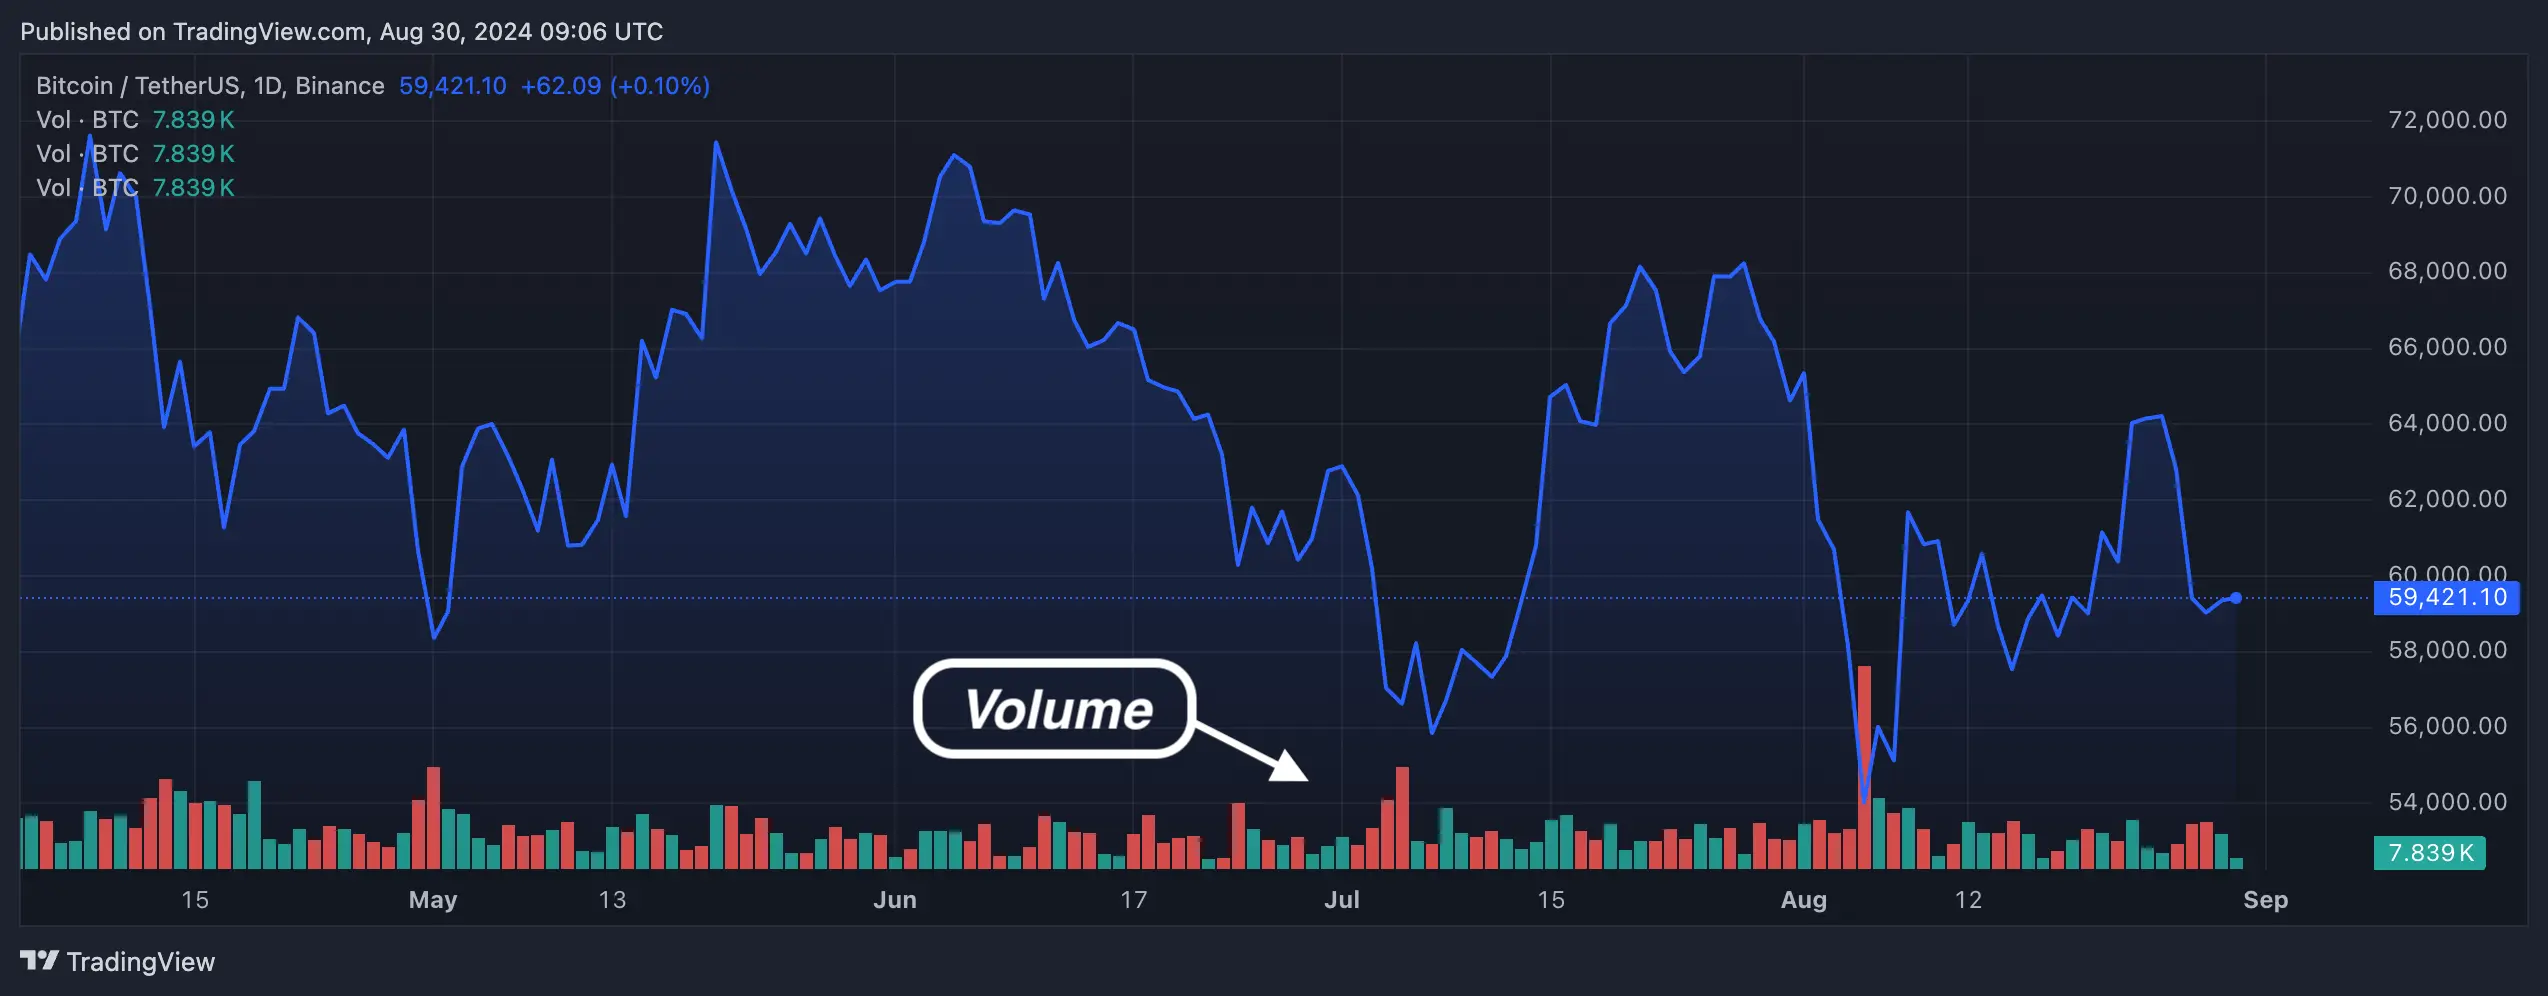
(Source: CoinMarketCap)
Explanation: Volume indicators measure the amount of a cryptocurrency traded during a specific period. High volume indicates strong interest in a particular price level, while low volume suggests a lack of conviction among traders. Volume is often considered a leading indicator, meaning it can signal upcoming price movements before they occur.
Usage: Traders use volume to confirm trends and identify potential reversals. For example, a price increase accompanied by high volume is more likely to be sustained than one with low volume. Conversely, a sharp price drop on high volume may indicate the start of a bearish trend. Volume analysis helps traders differentiate between genuine price movements and false signals, improving their chances of making successful trades.
Trend Lines
(Source: CoinRank)
Explanation: Trend lines are diagonal lines drawn on a chart to connect two or more price points. They help identify the direction of the market—whether it’s moving up, down, or sideways. Trend lines are one of the simplest yet most effective tools for identifying market trends.
Drawing Trend Lines: To draw a trend line, connect the lowest points (for an uptrend) or the highest points (for a downtrend) on the chart. The more points the line touches, the stronger the trend. Trend lines can also act as support or resistance levels, where prices tend to reverse or consolidate. Understanding how to draw and use trend lines effectively can greatly enhance a trader’s ability to navigate the market.
Support and Resistance Levels
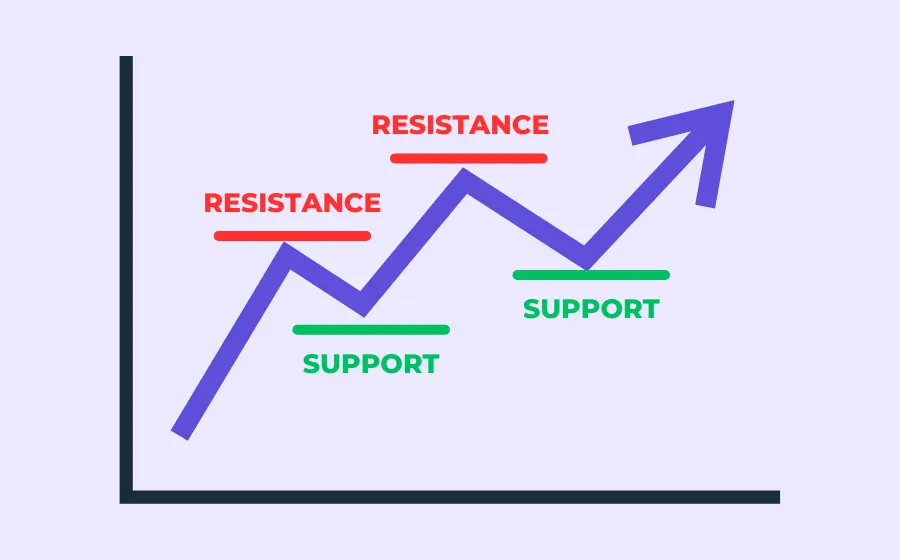
(Source: CoinRank)
Explanation: Support and resistance levels are horizontal lines that indicate price levels at which a cryptocurrency tends to stop and reverse. Support is the price level where buying pressure overcomes selling pressure, preventing the price from falling further. Resistance is the level where selling pressure overcomes buying pressure, preventing the price from rising further.
Identifying Levels: Support and resistance levels can be identified by looking at historical price data. These levels are significant because they often act as psychological barriers for traders. Prices tend to bounce off these levels rather than break through them, making them crucial points for entering or exiting trades.
POPULAR INDICATORS IN CRYPTO CHARTS
Technical indicators are essential tools used by traders to analyze price data and forecast market movements. These indicators are mathematical calculations based on price, volume, or open interest that are used to predict future price movements. Here are some of the most commonly used indicators in crypto trading.
>> Read more: 10 Best Technical Indicators for Crypto Trading in 2024
Moving Averages (MA)
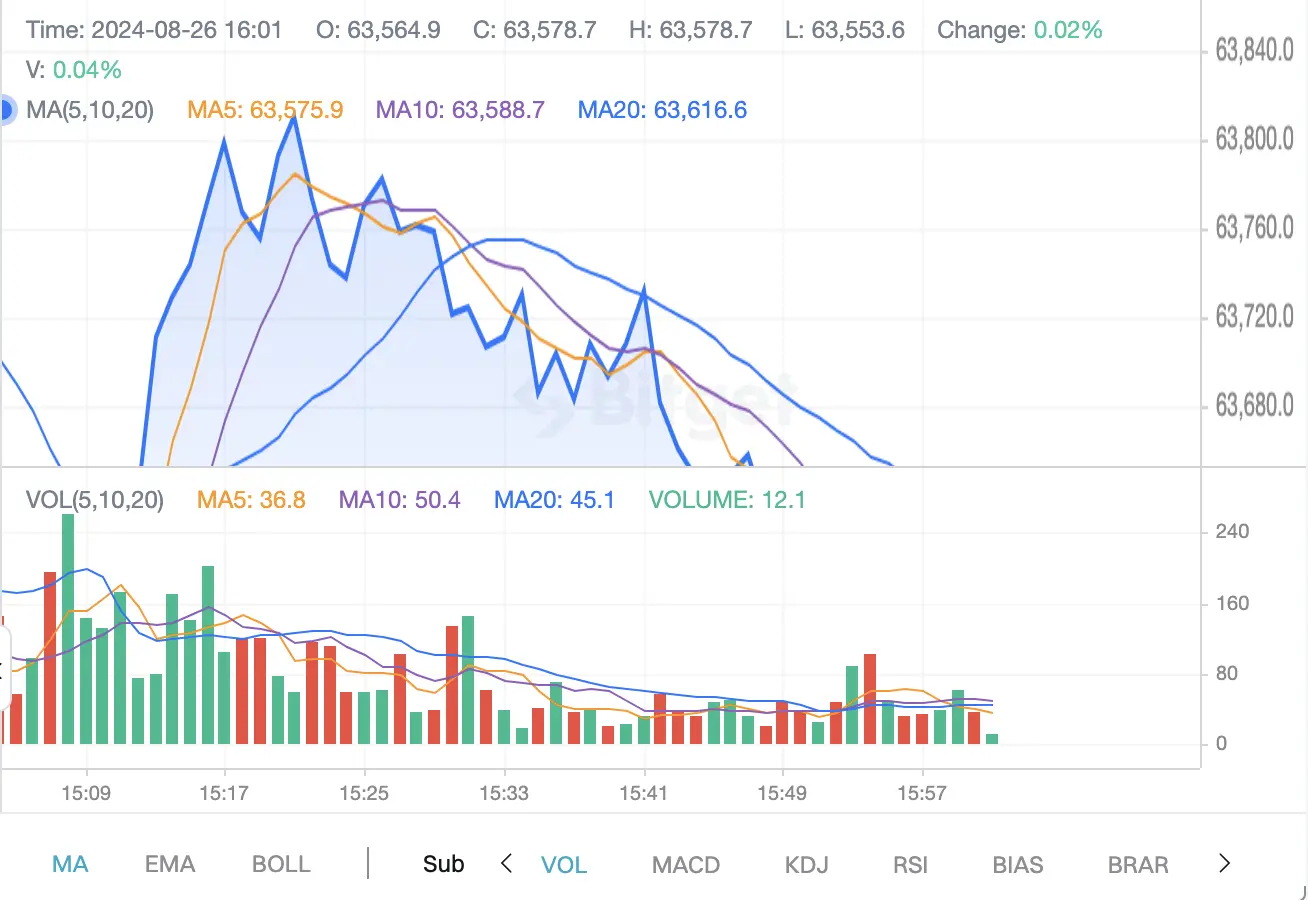
(Source: Bitget website)
Explanation: Moving averages smooth out price data to create a single flowing line, making it easier to identify trends. The two main types are the Simple Moving Average (SMA) and the Exponential Moving Average (EMA). While the SMA gives equal weight to all price points, the EMA gives more weight to recent prices, making it more responsive to recent price changes.
Application: Moving averages are used to determine the direction of the trend. A rising moving average suggests an uptrend, while a falling one indicates a downtrend. Traders often use moving averages in conjunction with other indicators to confirm trends or identify potential reversal points.
Relative Strength Index (RSI)
Explanation: The Relative Strength Index (RSI) is a momentum oscillator that measures the speed and change of price movements. It ranges from 0 to 100 and is used to identify overbought or oversold conditions. RSI values above 70 suggest that a cryptocurrency may be overbought, while values below 30 indicate it may be oversold.
Application: An RSI above 70 suggests that a cryptocurrency may be overbought, potentially leading to a price correction. Conversely, an RSI below 30 indicates that the asset may be oversold, signaling a possible price increase. Traders use RSI to identify potential buy or sell opportunities, especially when it is used in conjunction with other indicators.
>> Read more: What Is RSI, and How Do You Use It in the Crypto Market?
MACD (Moving Average Convergence Divergence)
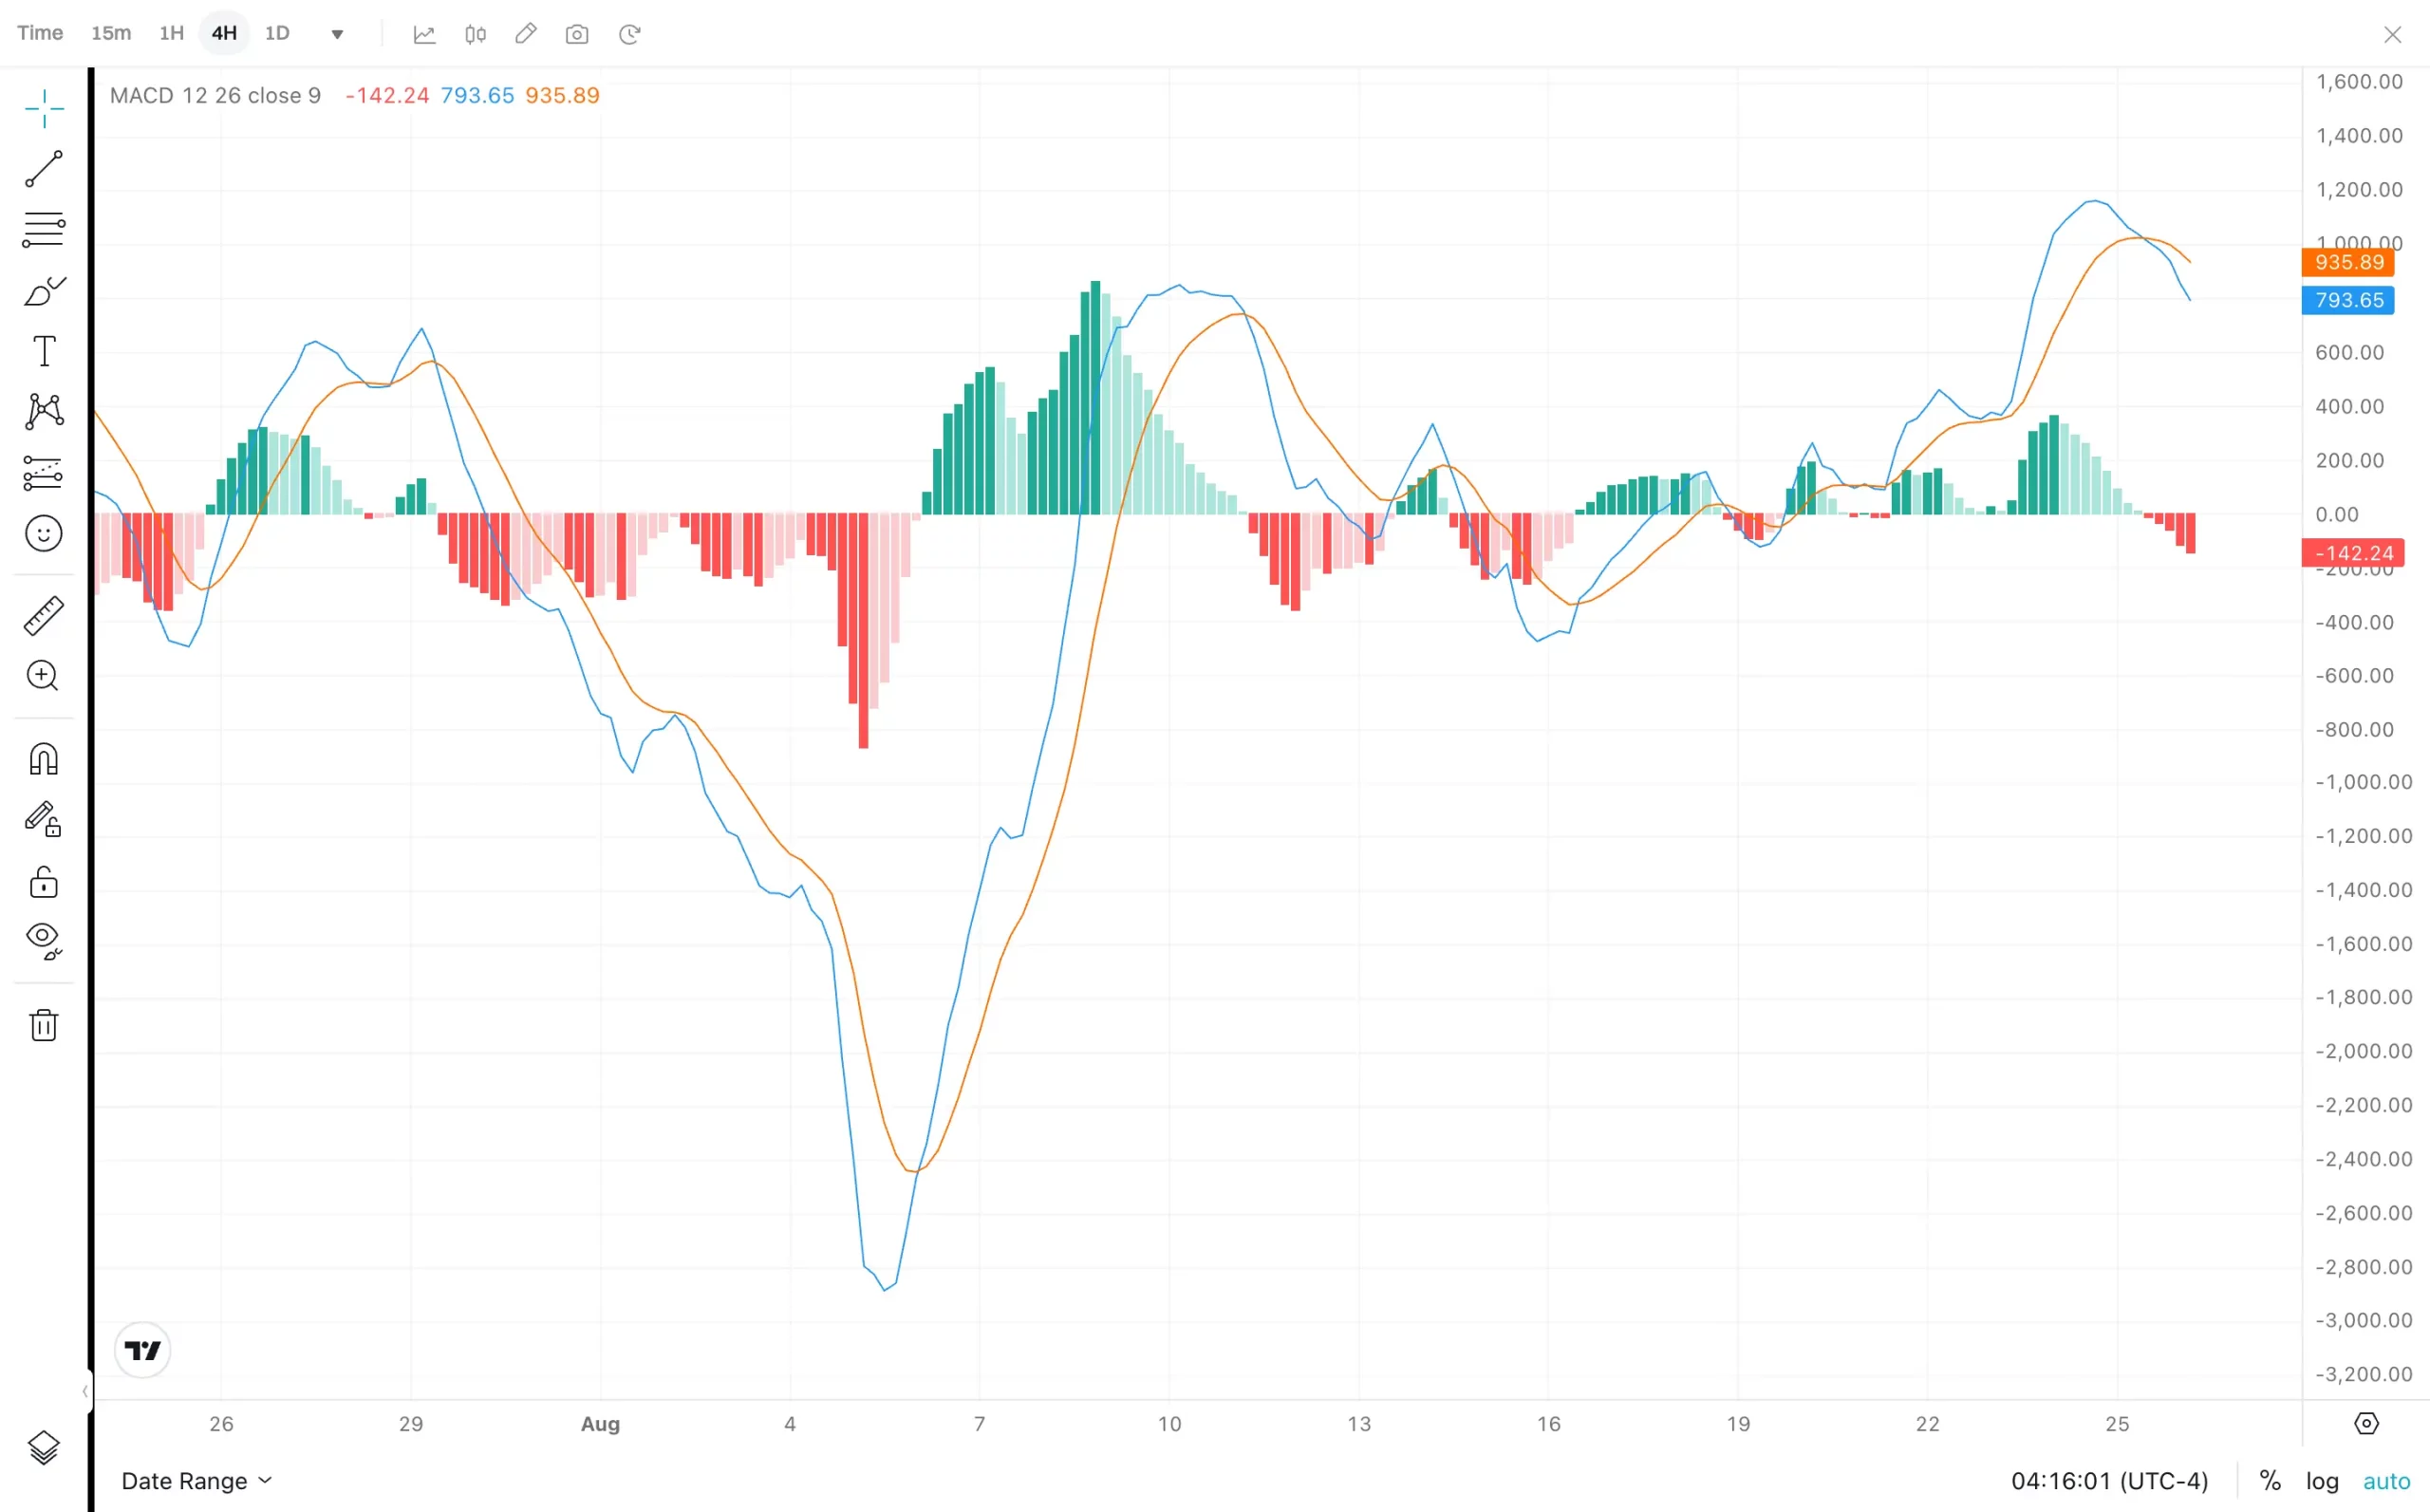
(Source: Bitget website)
Explanation: The MACD is a trend-following momentum indicator that shows the relationship between two moving averages of a cryptocurrency’s price. It consists of the MACD line, signal line, and histogram. The MACD line is the difference between two moving averages, while the signal line is an average of the MACD line.
Application: The MACD is used to identify potential buy or sell signals. When the MACD line crosses above the signal line, it’s a bullish signal, indicating that it might be a good time to buy. When it crosses below, it’s a bearish signal, suggesting that selling might be wise. The MACD histogram can also provide early signals of trend changes, helping traders stay ahead of the market.
>> Also read: What Is MACD? How It Works in Crypto Trading
Bollinger Bands
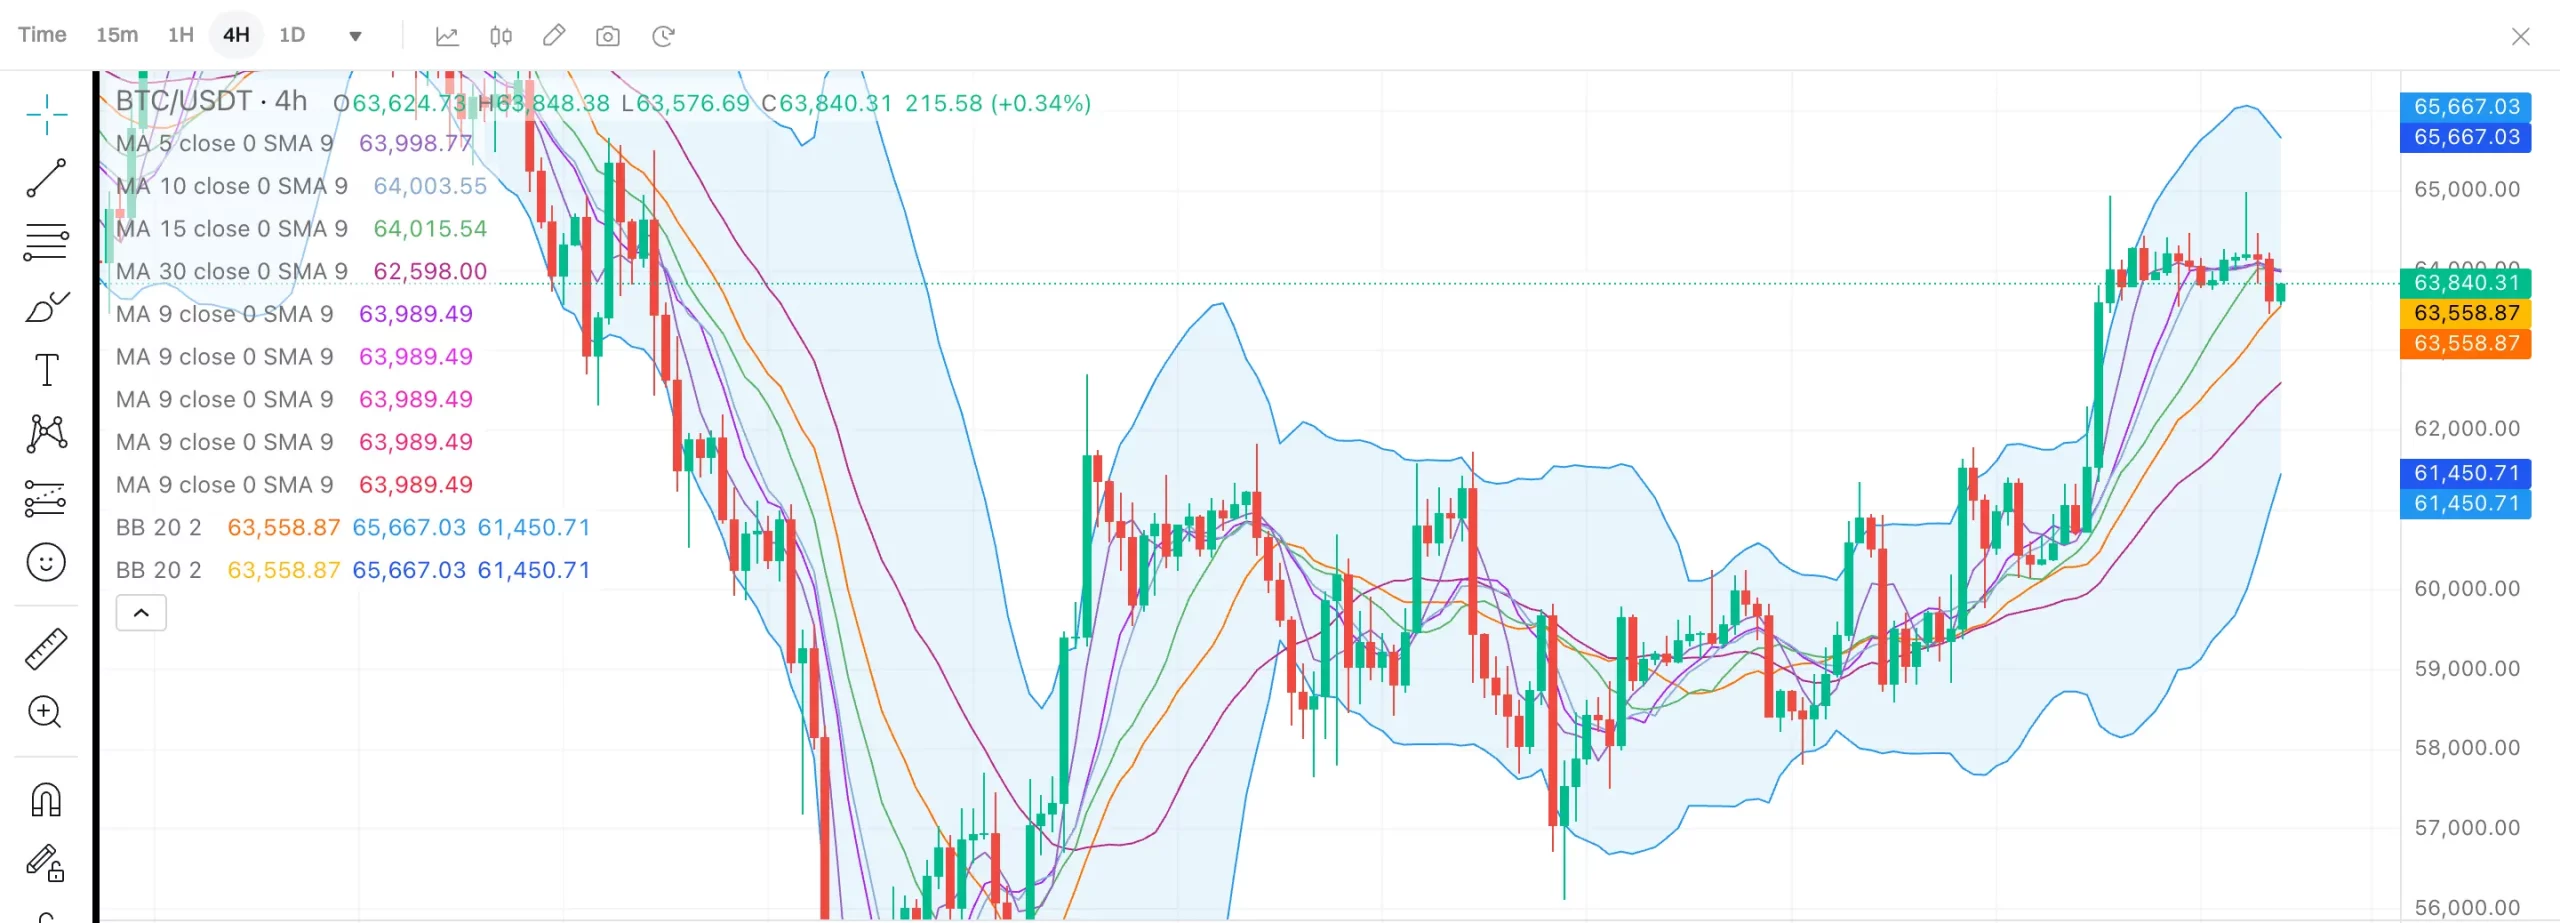
(Source: Bitget website)
Explanation: Bollinger Bands consist of a middle band (SMA) and two outer bands that represent standard deviations from the middle band. They measure market volatility and are used to identify overbought or oversold conditions. When prices move closer to the upper band, the asset may be overbought; when they approach the lower band, it may be oversold.
Application: Traders use Bollinger Bands to identify potential breakout opportunities. A squeeze, where the bands come close together, often precedes a period of increased volatility and potential price breakout. Bollinger Bands are particularly useful for traders looking to capitalize on sudden price movements.
>> Read more: 2024 Crypto Market Predictions Backed by Technical Analysis
HOW TO ANALYZE CRYPTO CHARTS
Analyzing crypto charts involves more than just looking at price movements. It requires a combination of tools and techniques to make informed trading decisions. Successful traders use a mix of trend analysis, pattern recognition, and multiple time frame analysis to develop a comprehensive view of the market.
Trend Analysis
Explanation: Trend analysis involves identifying the direction of the market by observing price movements and using technical indicators like moving averages and trend lines. Recognizing whether a market is trending upwards, downwards, or sideways is crucial for making strategic trading decisions.
Application: Traders look for bullish (upward) or bearish (downward) trends to make trading decisions. For example, if the market is in a bullish trend, a trader might consider buying on dips. Conversely, in a bearish trend, they might look to short sell or wait for the trend to reverse before buying.
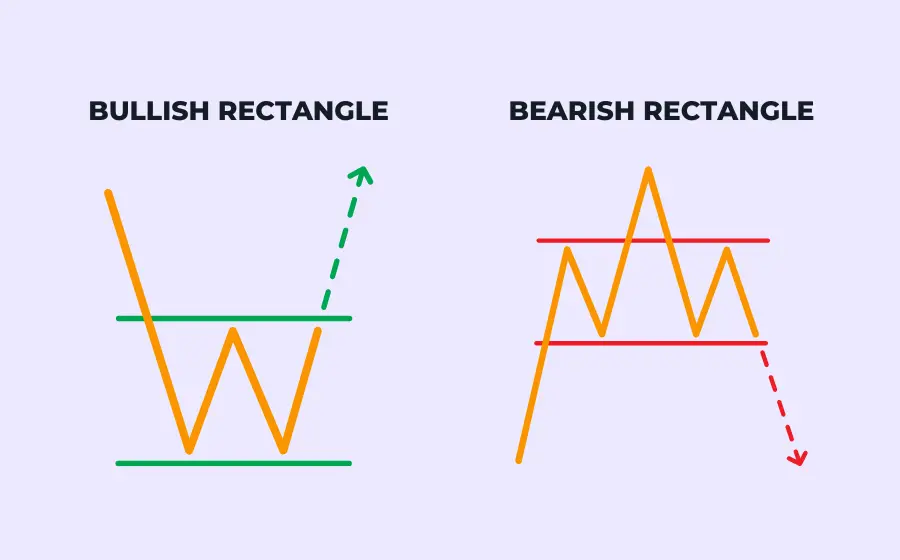
Pattern Recognition
Explanation: Chart patterns are specific shapes formed by price movements on a chart. Common patterns include head and shoulders, double tops and bottoms, and triangles. These patterns can signal potential trend reversals or continuations.
Application: Recognizing these patterns can help traders predict future price movements. For example, a head and shoulders pattern often indicates a potential reversal from an uptrend to a downtrend. By learning to identify these patterns, traders can make more accurate predictions about where the market is headed.
Using Multiple Time Frames
Explanation: Multiple time frame analysis involves looking at the same chart across different time frames to get a broader perspective of the market. This approach allows traders to see both the big picture and the finer details, providing a more comprehensive view of market conditions.
Application: By analyzing multiple time frames, traders can identify long-term trends and short-term entry points. For instance, a trader might use a daily chart to identify the overall trend and a 1-hour chart to find the best entry point. This technique helps traders avoid the pitfalls of relying on a single time frame, ensuring that their decisions are well-rounded and informed.
COMMON MISTAKES TO AVOID
Even experienced traders can make mistakes when analyzing crypto charts. Being aware of these common pitfalls can help you avoid costly errors and improve your trading success.
Overreliance on a Single Indicator
Explanation: Relying on one indicator for trading decisions can be misleading, as no single tool can provide all the answers. Markets are complex, and over-reliance on one metric can lead to incorrect conclusions.
Solution: Use a combination of indicators to confirm signals and ensure a more comprehensive analysis. By cross-referencing different tools, traders can validate their insights and reduce the risk of making poor decisions based on incomplete data.
Ignoring Market Conditions
Explanation: Focusing solely on charts without considering broader market conditions can lead to incorrect conclusions. Market sentiment, news events, and economic factors all play a significant role in price movements.
Solution: Always factor in market sentiment, news events, and other external influences when analyzing charts. By staying informed about the wider context, traders can better anticipate market reactions and adjust their strategies accordingly.
Failing to Adapt to Changing Trends
Explanation: Markets are dynamic, and what worked yesterday may not work today. Sticking rigidly to one analysis approach can be risky and lead to missed opportunities or losses.
Solution: Stay flexible and adapt your strategies as market conditions change. Regularly reviewing and adjusting your approach ensures that your trading strategy remains relevant and effective in different market environments.
CONCLUSION
Reading and analyzing crypto charts is an essential skill for anyone involved in cryptocurrency trading. By understanding the different types of charts, key components, and popular indicators, you can make more informed trading decisions. This knowledge is critical in navigating the volatile crypto markets and achieving long-term trading success.
Practice makes perfect. The more you work with crypto charts, the more proficient you will become in interpreting the data and making profitable trades. Continuously refining your skills and staying updated with market trends will help you maintain a competitive edge.
>> Also read: