


KEYTAKEAWAYS
- RSI is a powerful tool for identifying market trends and potential reversals in crypto trading.
- Use RSI in combination with other indicators and strategies to optimize your trading decisions.
CONTENT
Learn how to effectively use the Relative Strength Index (RSI) in the crypto market, from basic concepts to advanced strategies, to enhance your trading performance and make more informed decisions in a volatile environment.
INTRODUCTION
The Relative Strength Index (RSI) is one of the most widely used technical indicators in financial markets, offering traders insights into potential market trends and reversals. Originally developed for traditional stock markets, RSI has found significant relevance in the fast-paced and volatile world of cryptocurrency trading. This article aims to provide an in-depth understanding of RSI, explaining its basics, advanced strategies, and practical applications in the crypto trading world.
(Source: CoinRank)
HISTORY AND DEVELOPMENT OF RSI
📌 The Origin Of The Relative Strength Index
The Relative Strength Index was developed by J. Welles Wilder, Jr. and introduced to the public in 1978 through his book “New Concepts in Technical Trading Systems.” Wilder created the RSI to measure the speed and change of price movements, offering traders a means to identify overbought and oversold conditions in a market. Initially, RSI was primarily used in traditional stock markets.
📌 Evolution Of RSI In Crypto Trading
As cryptocurrency markets emerged and evolved, the RSI was quickly adopted by crypto traders due to its versatility and effectiveness. While the basic principles remain the same, the volatility of the crypto market has led to some adaptations in how RSI is applied. Traders often tweak the settings or use RSI in combination with other indicators to better navigate the unique challenges of crypto trading.
>>> More to read: What is MACD? How It Works in Crypto Trading
UNDERSTANDING RSI: THE BASICS
📌 RSI Formula And Calculation
At its core, the RSI is a momentum oscillator that calculates the speed and change of price movements. The RSI formula is as follows:
RSI = 100 − (100 / (1 + RS))
Where RS (Relative Strength) is the average of ‘n’ days’ up closes divided by the average of ‘n’ days’ down closes. Typically, the standard ‘n’ is 14, meaning the RSI is calculated over a 14-period timeframe. For example, if a cryptocurrency has closed higher seven times and lower seven times over the past 14 days, the RSI would provide a value that indicates whether the asset is overbought, oversold, or in neutral territory.
📌 Overbought And Oversold Conditions
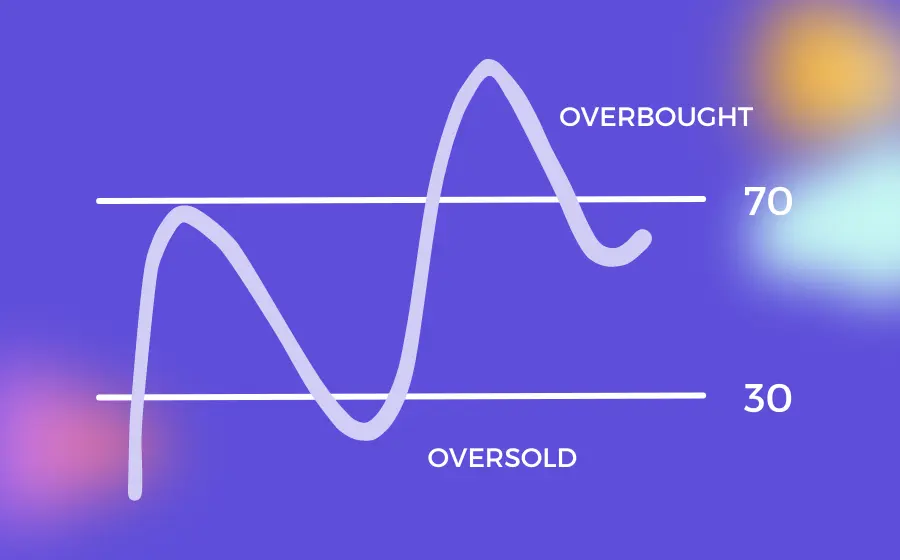
RSI is primarily used to identify overbought and oversold conditions in an asset. When the RSI value is above 70, the asset is considered overbought, suggesting it might be overvalued and due for a price correction. Conversely, when the RSI is below 30, the asset is considered oversold, indicating it might be undervalued and due for a price increase.
(Source: CoinRank)
📌 Interpreting RSI Readings
✅ Understanding the 0-100 Scale
RSI readings range from 0 to 100. A reading above 70 suggests that the asset is overbought, and a reading below 30 suggests it is oversold. The 50 level is often seen as a neutral point where the market is neither overbought nor oversold. Traders use these levels to gauge potential entry and exit points in the market.
✅ Divergence Analysis
Divergence occurs when the price of an asset moves in the opposite direction of the RSI. There are two types of divergence: bullish and bearish. A bullish divergence happens when the price makes a new low, but the RSI makes a higher low, indicating a potential upward reversal. Conversely, a bearish divergence occurs when the price makes a new high, but the RSI makes a lower high, signaling a possible downward reversal. Divergence is a powerful tool in crypto trading, helping traders identify potential trend reversals.
>>> More to read: What is Moving Average (MA)? How Does It Work
APPLYING RSI TO CRYPTO TRADING
🚩 Identifying Trend Reversals
One of the most common uses of RSI in crypto trading is to identify potential trend reversals. When RSI indicates that an asset is overbought or oversold, it suggests that a price reversal may be imminent. For example, if Bitcoin’s RSI climbs above 70, it could indicate that the asset is overbought and due for a pullback. Traders can use this information to time their entries and exits more effectively.
🚩 Confirming Trends with RSI
RSI is also useful for confirming trends. By combining RSI with other technical indicators, such as moving averages, traders can confirm the strength and direction of a trend. For instance, if RSI is above 50 and the price is above a key moving average, it can confirm the bullish trend, making it a more reliable signal for entering long positions.
🚩 RSI Settings For Crypto Trading
▶ Default RSI Settings
The default setting for RSI is 14 periods, which is the most commonly used setting across different financial markets, including cryptocurrencies. This setting smoothens out short-term price fluctuations, providing a clearer view of the overall market trend.
▶ Customizing RSI for Volatile Markets
Given the high volatility of the cryptocurrency markets, some traders prefer to customize the RSI settings. For instance, a shorter period RSI (e.g., 7 periods) might provide more responsive signals in a fast-moving market, while a longer period RSI (e.g., 21 periods) might filter out noise and provide more reliable signals in a less volatile market. Experimenting with different settings can help traders find the RSI configuration that best suits their trading style and market conditions.
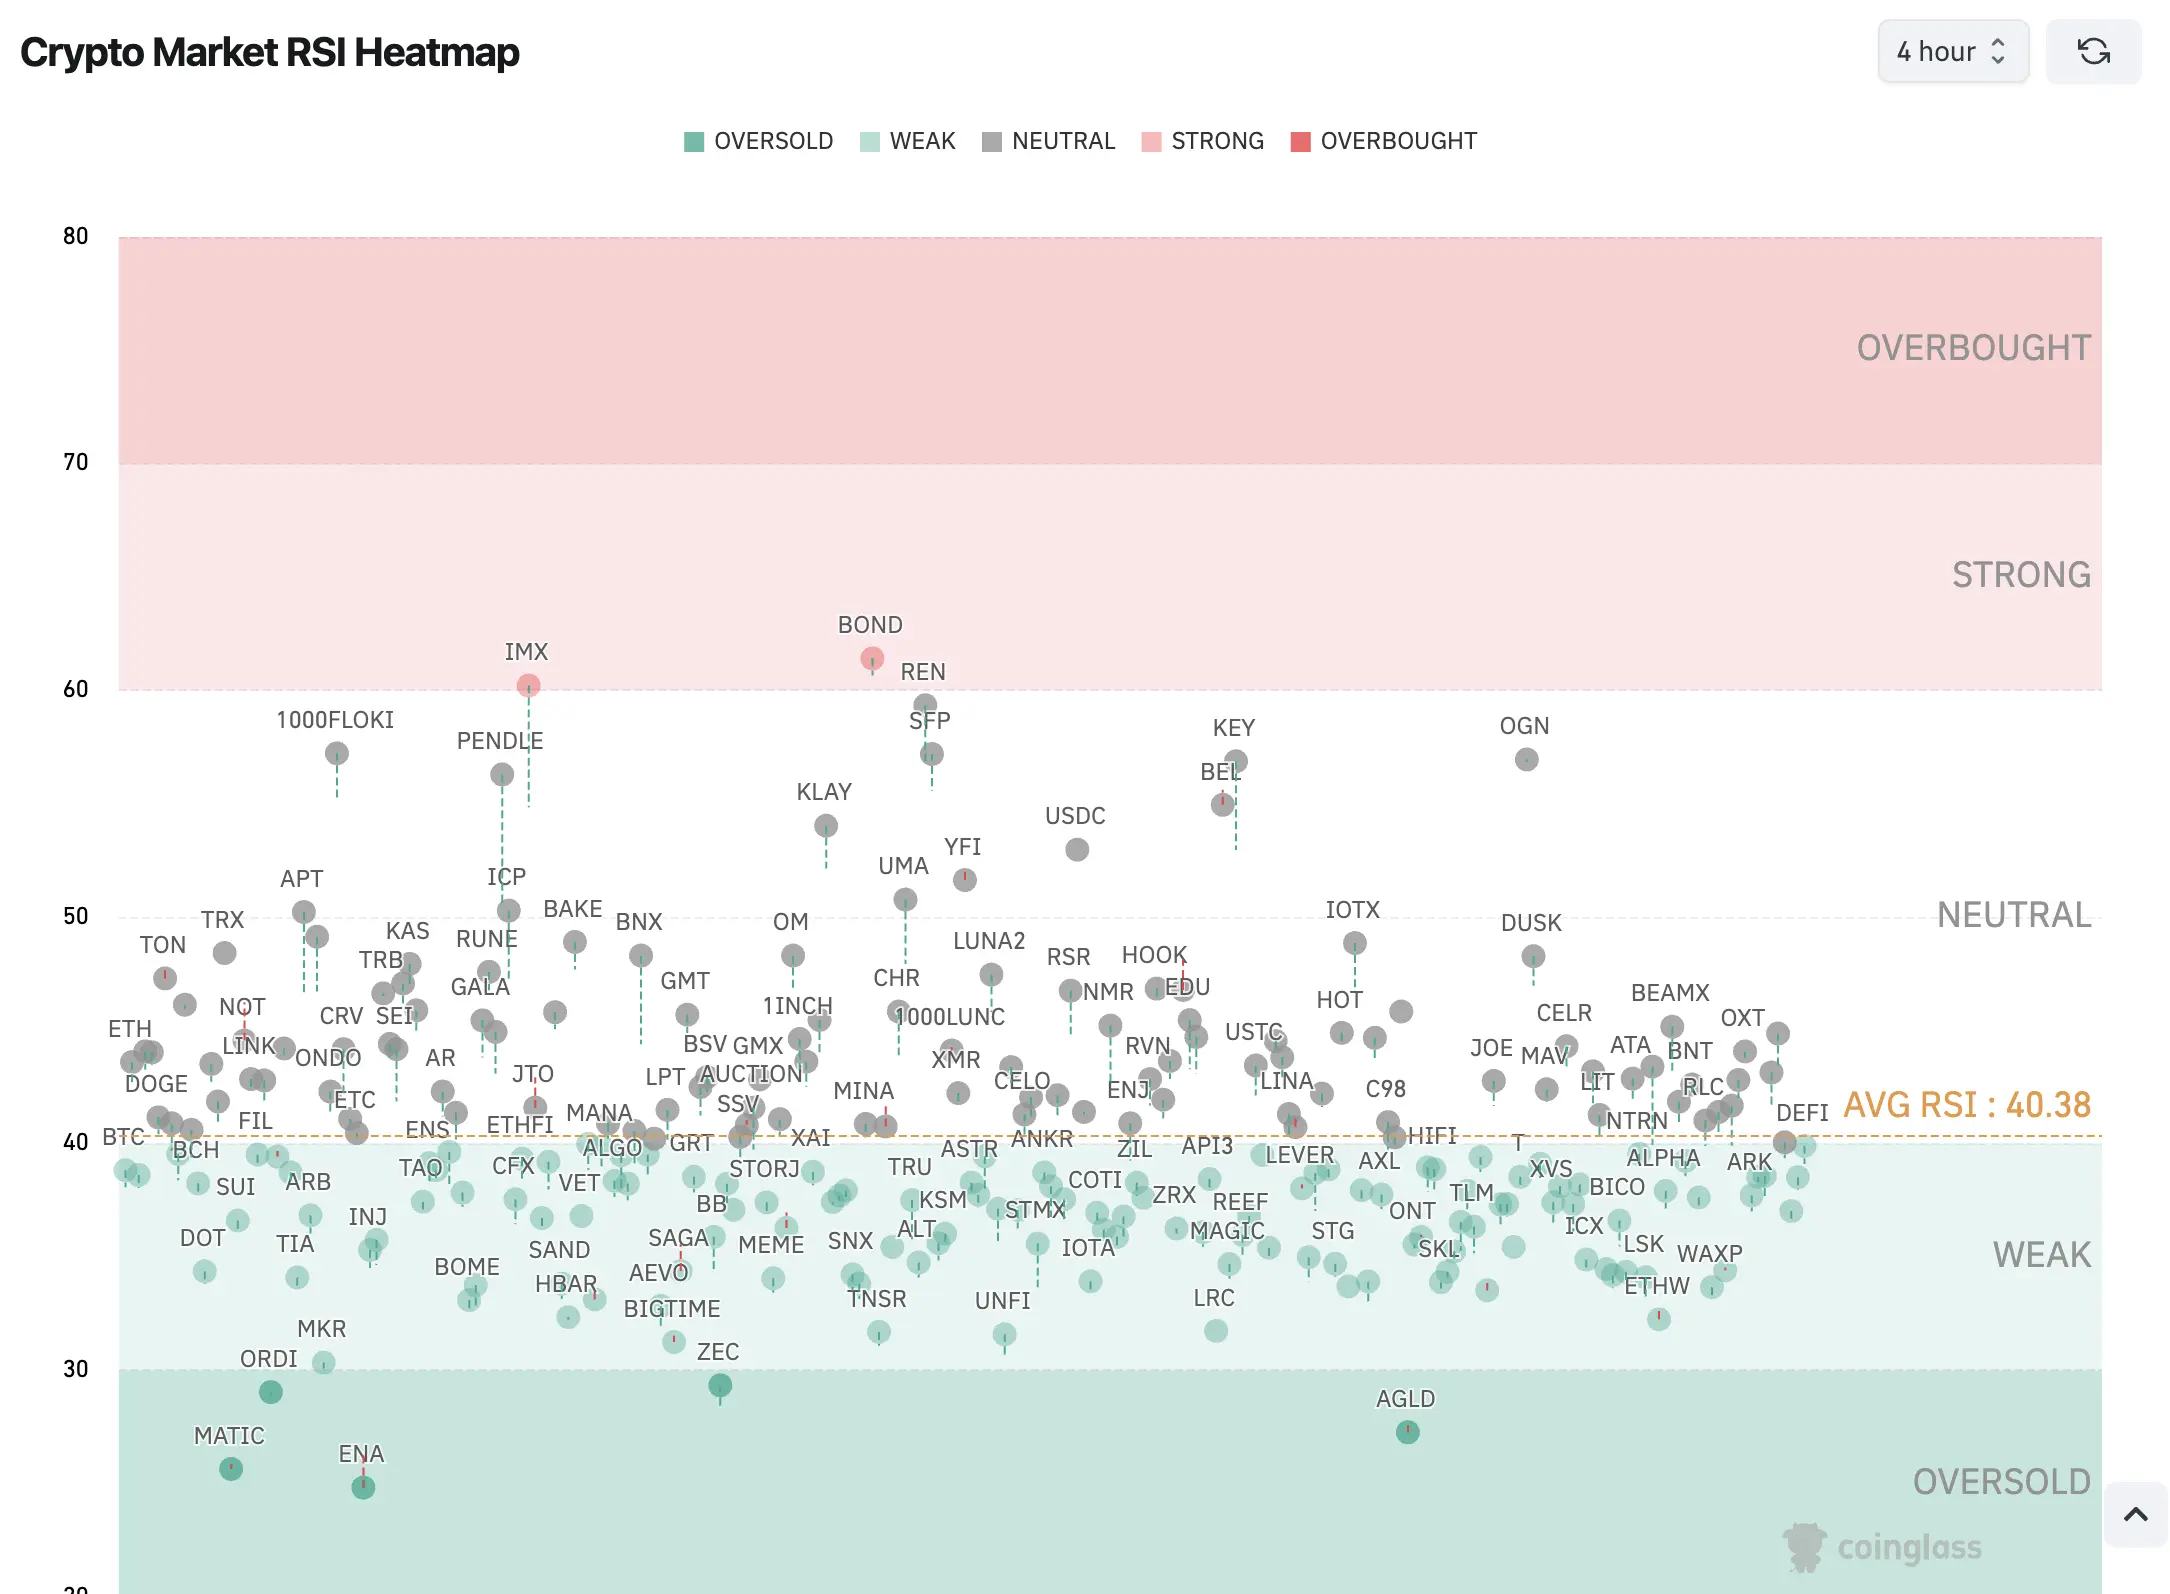
(Source: Coinglass – Crypto Market RSI Heatmap)
ADVANCED RSI STRATEGIES
1️⃣ Using RSI with Moving Averages
▶ Identifying Trend Reversals
Combining RSI with moving averages is a common strategy among crypto traders. Moving averages help identify the direction of the trend, while RSI provides information about the strength of that trend. For example, if the price of Ethereum is above its 50-day moving average and RSI is above 50, it suggests a strong bullish trend. This combination can be used to confirm entry points and avoid false signals.
▶ RSI and MACD
The Moving Average Convergence Divergence (MACD) is another popular indicator that can be combined with RSI. While RSI measures momentum, MACD shows the relationship between two moving averages of an asset’s price. Using these two indicators together can provide a more comprehensive view of the market. For example, a bullish MACD crossover combined with an RSI reading above 50 can be a strong signal to buy.
2️⃣ RSI In Different Time Frames
▶ Short-Term vs. Long-Term RSI
RSI can be applied to different time frames, each offering unique insights. In short-term trading (e.g., hourly charts), RSI can help identify quick entry and exit points based on short-term overbought and oversold conditions. In long-term trading (e.g., daily or weekly charts), RSI can be used to identify more significant trend reversals or continuations. Each time frame has its advantages and disadvantages, and the choice of time frame depends on the trader’s strategy and risk tolerance.
▶ Multi-Time Frame RSI Analysis
Multi-time frame analysis involves looking at RSI across different time frames to get a more comprehensive view of the market. For example, a trader might look for alignment between the RSI on the daily, weekly, and monthly charts to confirm a trend’s strength or potential reversal. This approach can help traders avoid false signals and make more informed trading decisions.
>>> More to read: What are Bollinger Bands & How to Use Them
COMMON MISTAKES & HOW TO AVOID THEM
✅ Common Pitfalls When Using RSI
▶ Over-Reliance on RSI
One of the most common mistakes traders make is relying solely on RSI for their trading decisions. While RSI is a powerful tool, it should not be used in isolation. Over-reliance on RSI can lead to missed opportunities or false signals, especially in highly volatile markets like cryptocurrencies. It’s essential to use RSI in conjunction with other indicators and fundamental analysis to make well-rounded trading decisions.
▶ Ignoring Market Conditions
RSI readings can be affected by overall market conditions. For example, during a strong bull market, RSI may remain in the overbought zone for extended periods, and selling solely based on RSI could result in missed profits. Conversely, in a bear market, RSI may remain oversold for longer than usual. Understanding the broader market context is crucial when interpreting RSI signals.
✅ Best Practices For RSI Use
▶ Combining RSI with Fundamental Analysis
While RSI is a technical indicator, it’s important not to ignore fundamental analysis when using it. Fundamental factors such as news events, regulatory changes, or technological advancements can significantly impact the price of a cryptocurrency, sometimes rendering RSI signals less reliable. By combining RSI with fundamental analysis, traders can better assess the overall market environment and make more informed decisions.
▶Continual Learning and Adaptation
The crypto market is constantly evolving, and so should your trading strategies. Continually refining your RSI strategies, adapting to changing market conditions, and staying informed about new developments are essential practices for successful trading. Resources like trading courses, webinars, and market analysis tools can help traders keep their skills sharp and adapt to the ever-changing landscape of cryptocurrency trading.
>>> More to read: Crypto Beginner’s Guide | What, Why, Where, When, Who
REAL-WORLD EXAMPLES OF RSI IN CRYPTO TRADING
✏️ Case Study 1: Bitcoin RSI Analysis
Let’s look at a real-world example of how RSI was used to make profitable trades with Bitcoin. During a significant bull run, Bitcoin’s RSI consistently hovered around the overbought territory, signaling potential pullbacks. By paying attention to RSI, traders were able to time their exits before major corrections, preserving their profits.
✏️ Case Study 2: Ethereum RSI Analysis
Similarly, Ethereum traders have used RSI to identify oversold conditions during market dips. In one instance, when Ethereum’s RSI dropped below 30, it indicated an oversold condition. Traders who recognized this signal were able to enter the market at a low point, leading to substantial gains when the market rebounded.
CONCLUSION
In conclusion, the Relative Strength Index is a powerful tool for crypto traders, offering valuable insights into market momentum and potential trend reversals. However, like any tool, it is most effective when used as part of a broader trading strategy that includes other technical indicators and fundamental analysis. By understanding the basics, exploring advanced strategies, and learning from real-world examples, traders can use RSI to enhance their trading performance and make more informed decisions in the volatile world of cryptocurrency trading.
>> Also read:
- 5 Indicators for Crypto Market Analysis and Where to Find Them
- How Are Crypto Assets Taxed? A Country-by-Country Overview